Help
Step-by-step user manual: search, browse genes & diseases, pathway analysis, enrichment, comorbidity, and more.
Venn Analysis
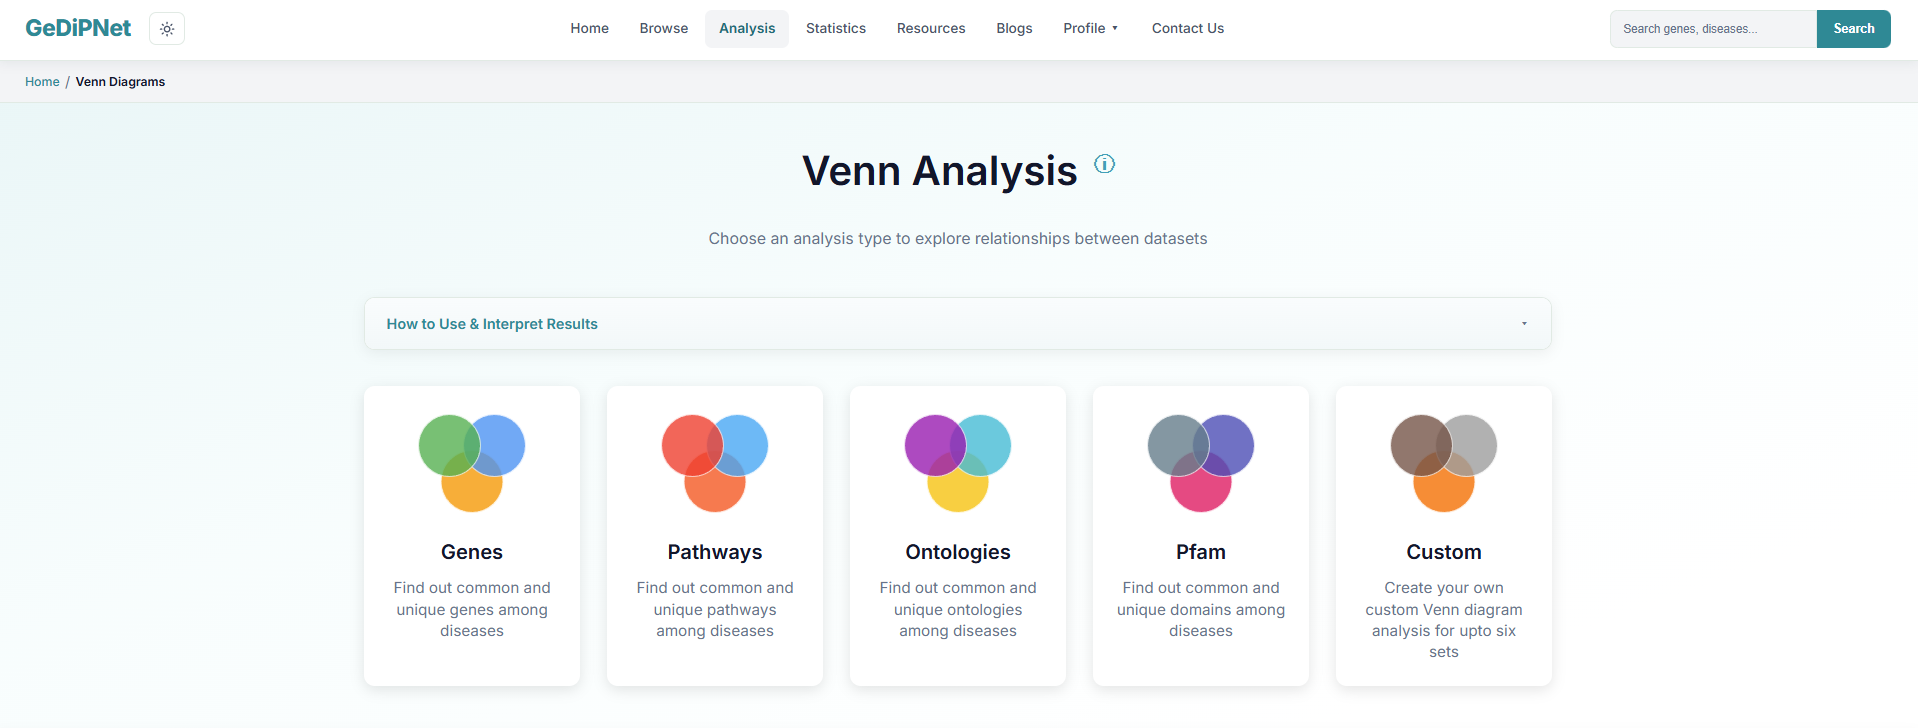
The Venn Analysis tool illustrates the unique and/or common genes, pathways, ontologies, and Pfam domains for 2 or more (up to 6) diseases — plus a Custom option for entering your own lists directly. A collapsible "How to Use & Interpret Results" panel above the analysis cards walks through picking a comparison type, entering disease names, and reading the output.
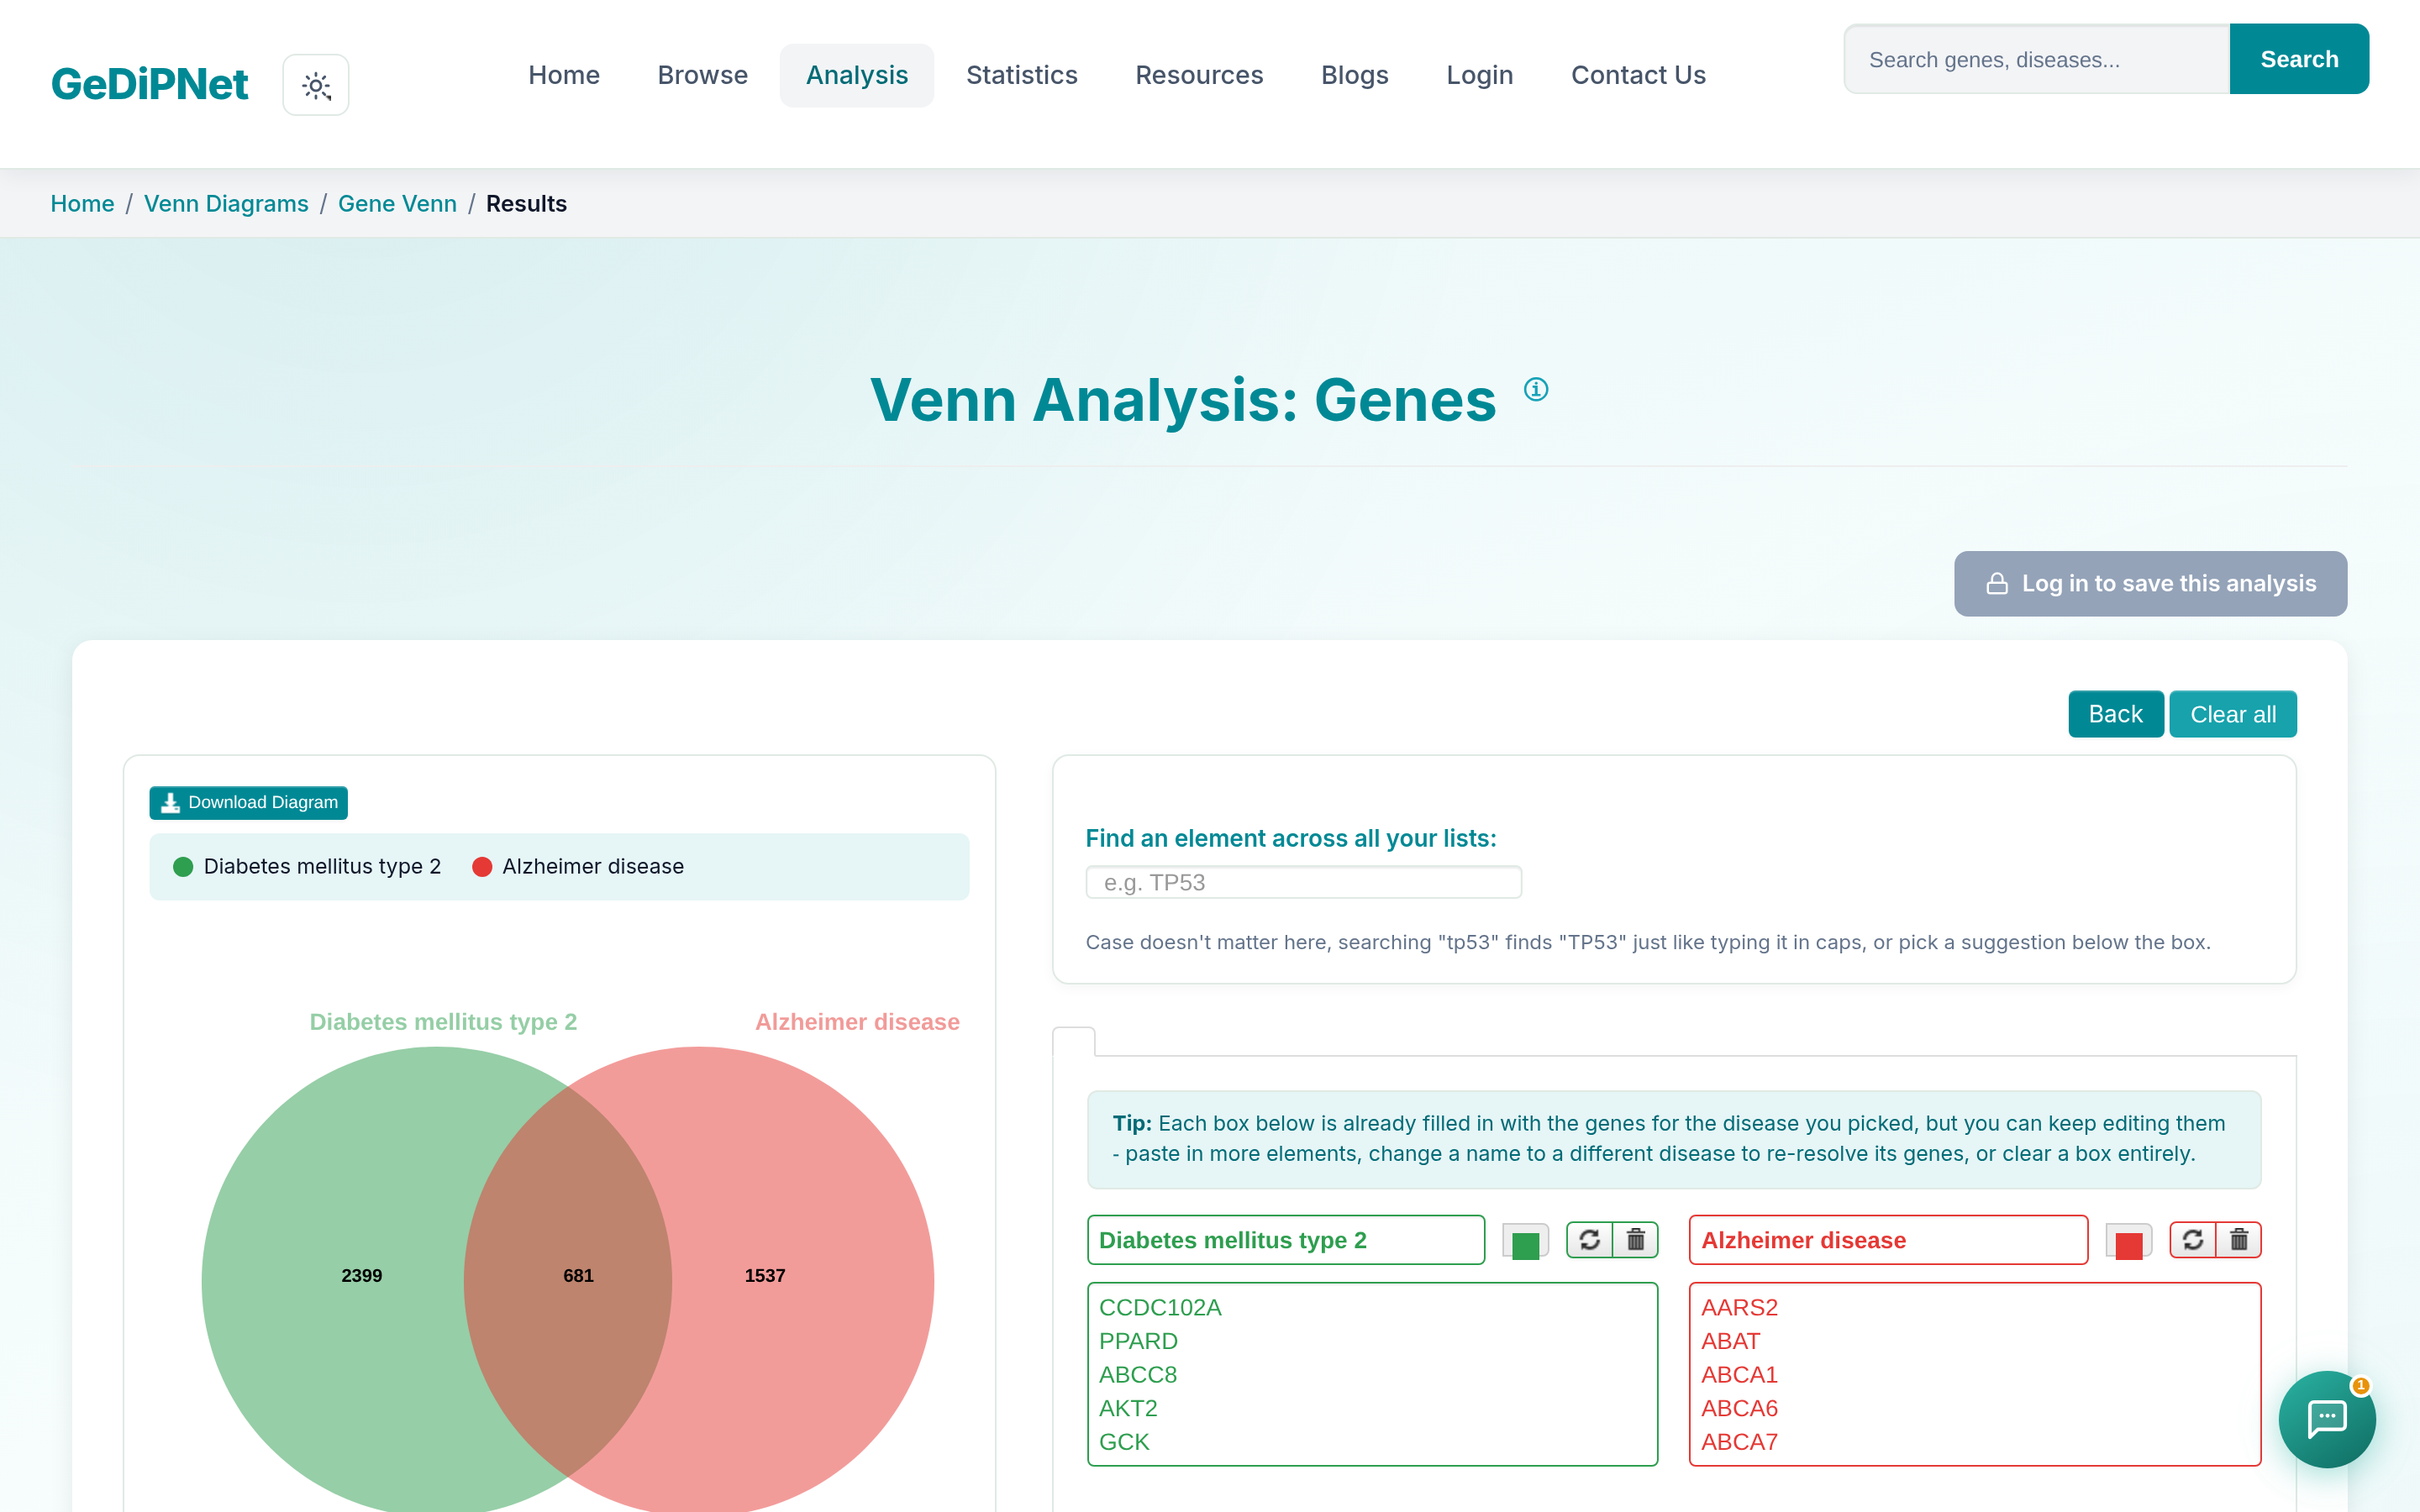
On selecting one type of Venn analysis, you're taken to that Venn's own page. Disease names can be typed in or autocompleted from the database; click Generate Venn Diagram to see the interactive output, or use Load Example on the input page first to see a worked example. Each region of the diagram is clickable for its exact item list, and the diagram and full comparison table each have their own download button.
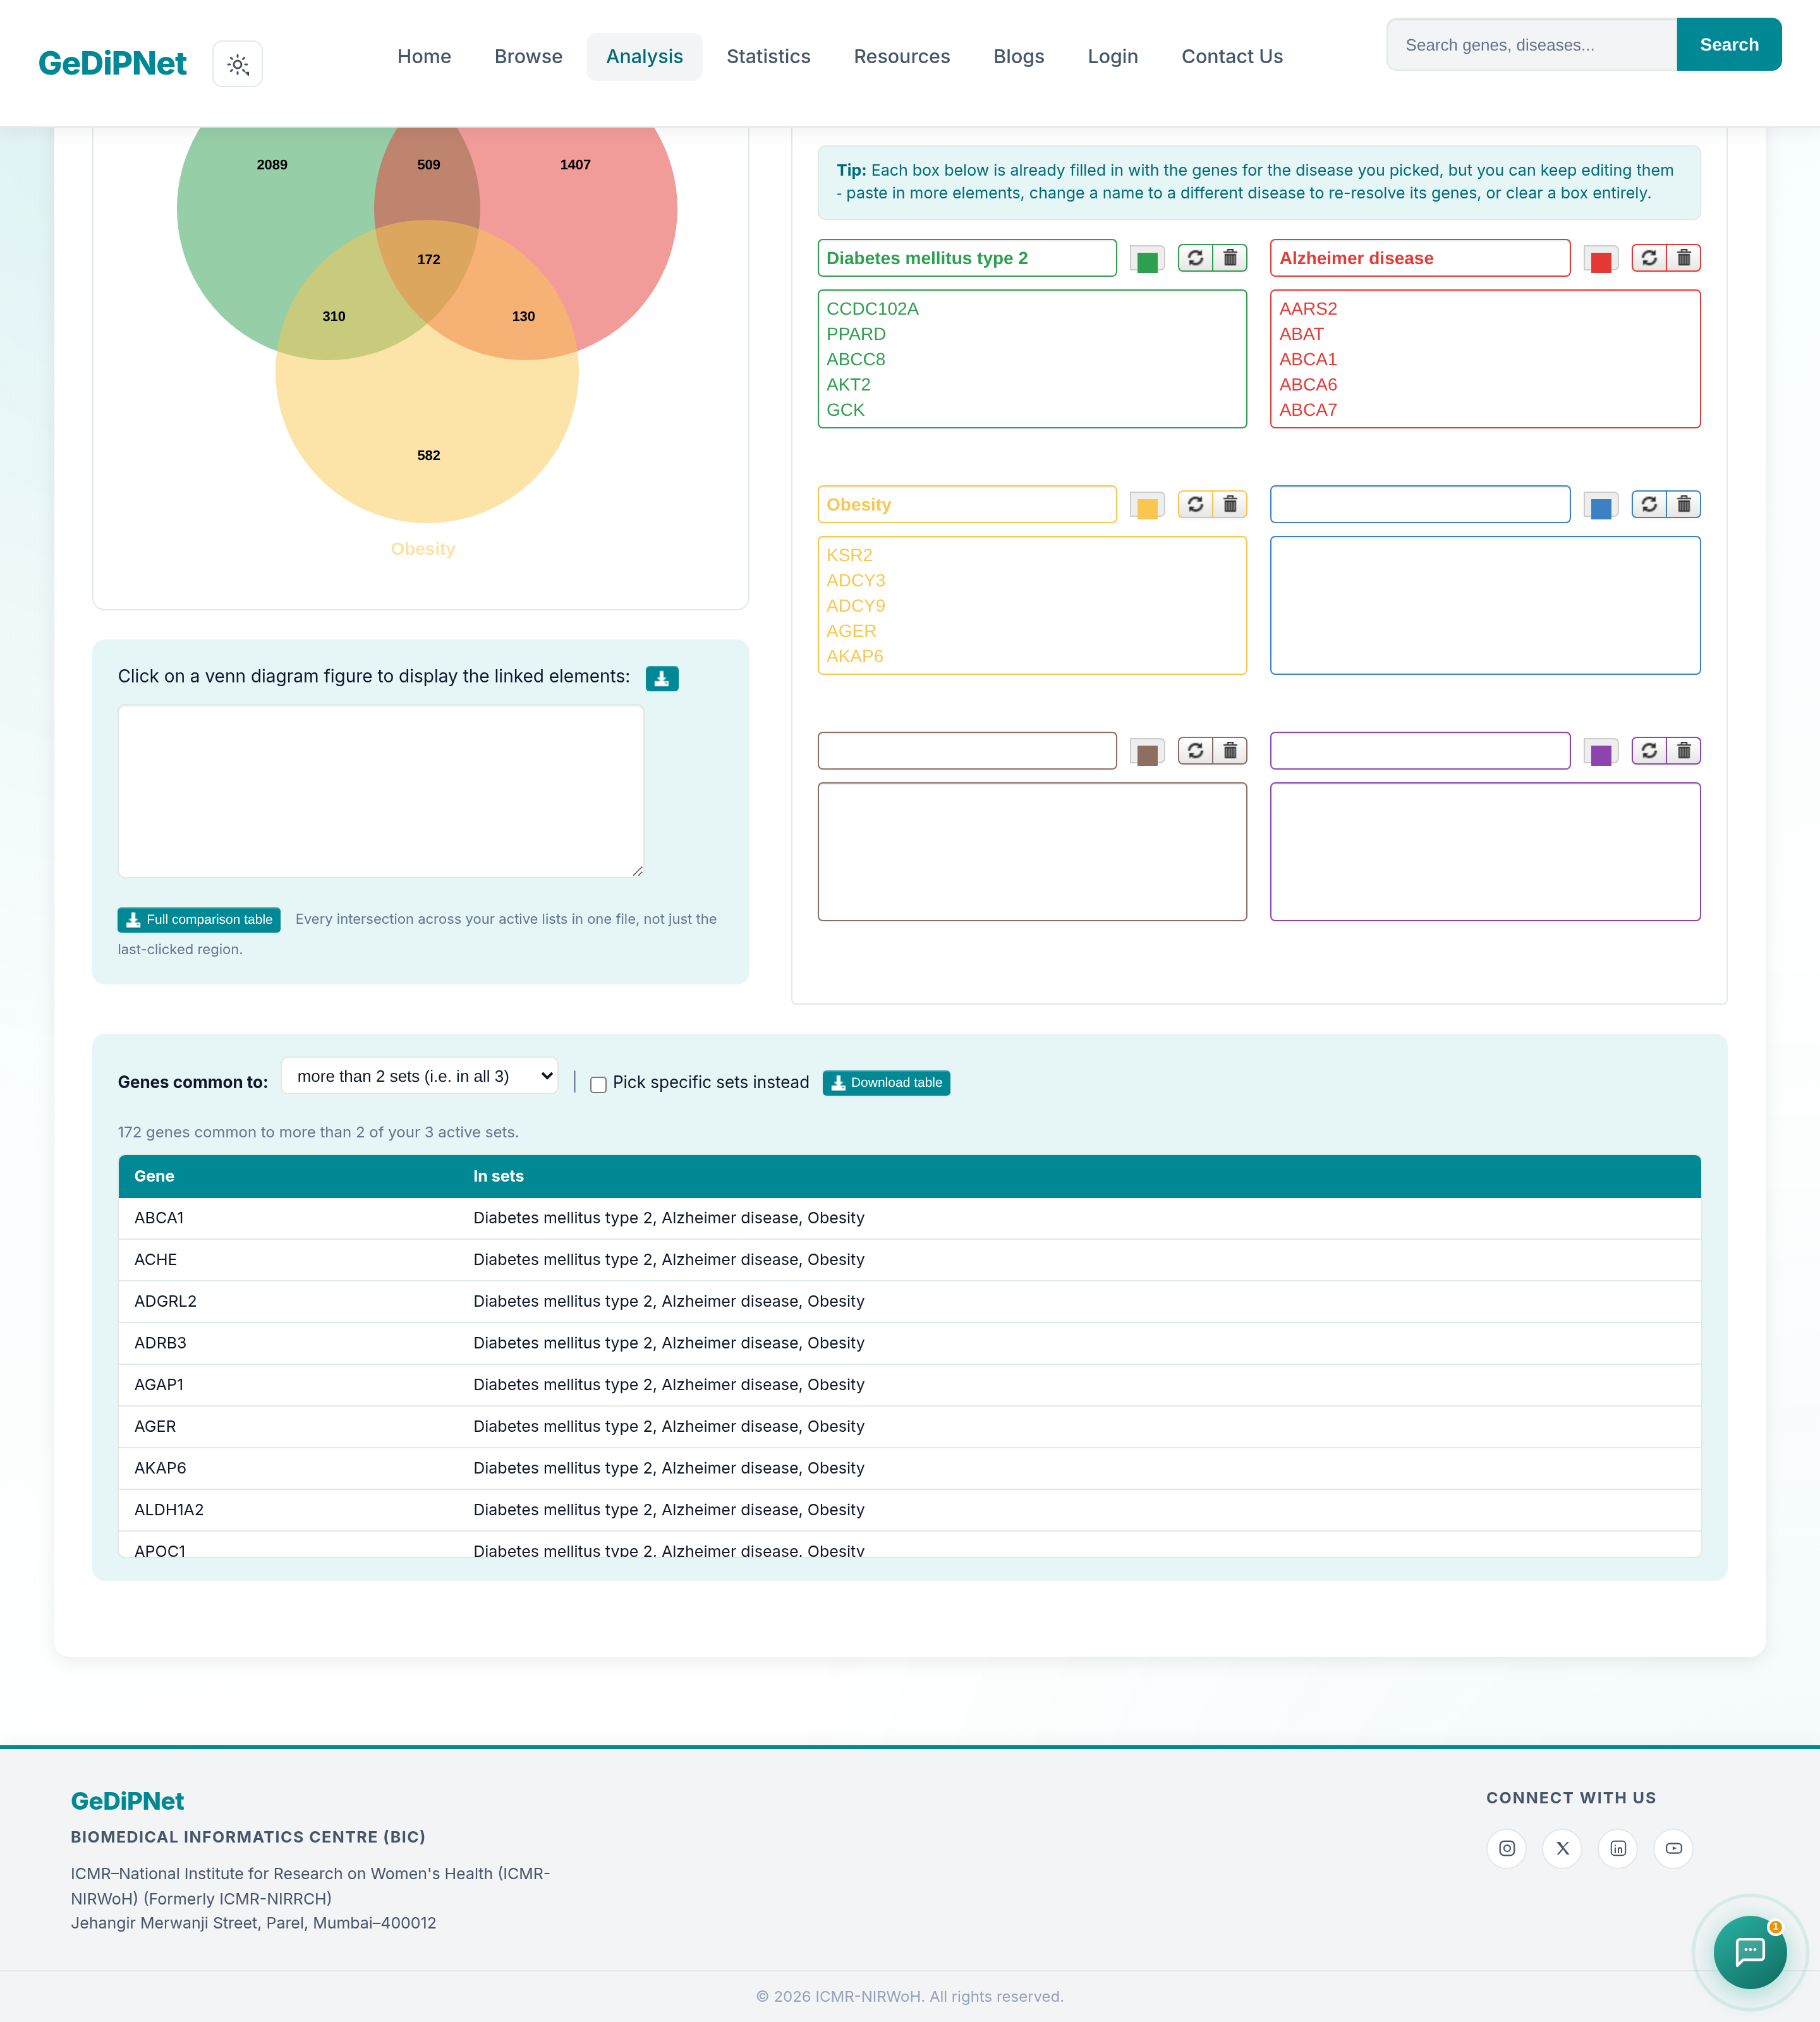
With 3 or more sets active, a Common Across Most Sets table appears below the diagram — useful once a diagram gets crowded enough that eyeballing "what's shared by most of my sets" isn't practical. It defaults to items common to more than half your active sets (adjustable to any threshold via a dropdown), or check "Pick specific sets instead" to get an exact picker: choose any 2 or more of your sets by name and see what's common to exactly that combination, regardless of your other lists. The table has its own CSV/PDF download, separate from the diagram image and full-comparison downloads.