Help
Step-by-step user manual: search, browse genes & diseases, pathway analysis, enrichment, comorbidity, and more.
Polypharmacological Target Prediction
The Polypharmacological Target Prediction tool builds a protein interaction network from the genes shared across the diseases (or genes) you select, and identifies potential multi-target drug candidates and their known drugs from DGIdb. Choose a Disease entry point (select multiple diseases and find the genes, pathways, and drug targets common to all of them) or a Gene entry point to start directly from a set of genes, then pick a dataset — Curated or Curated + Text Mining.
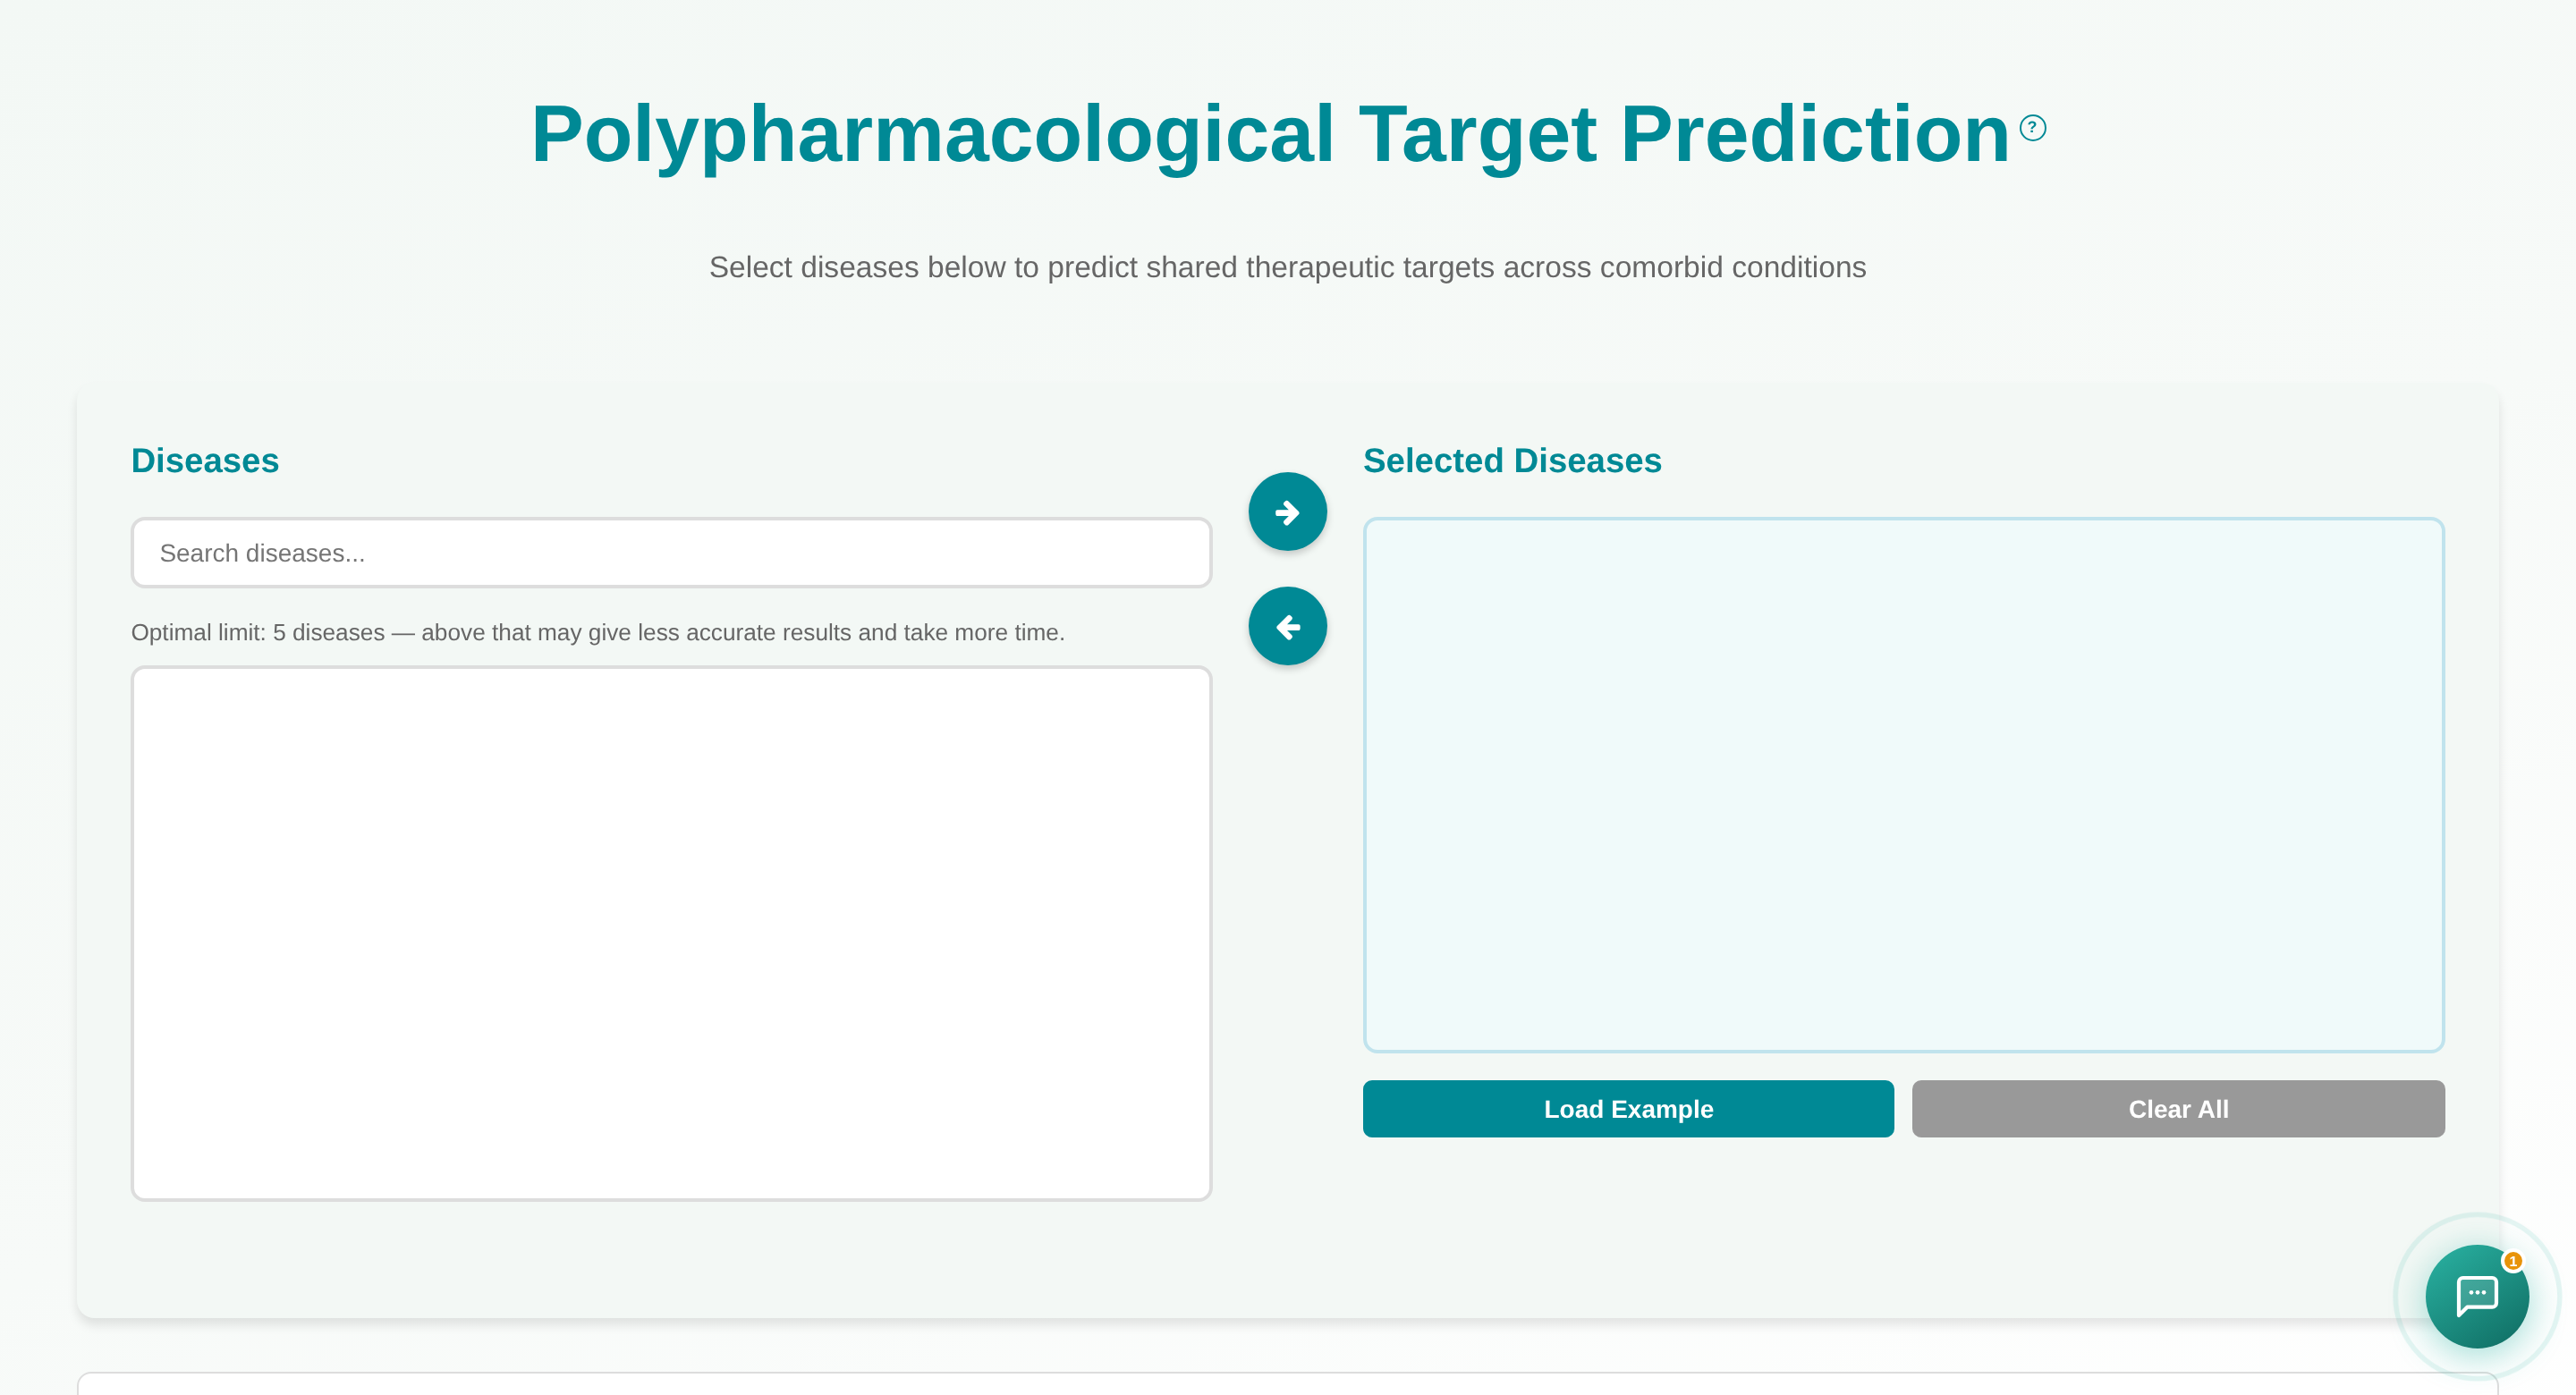
Results span 7 tabs, in order:
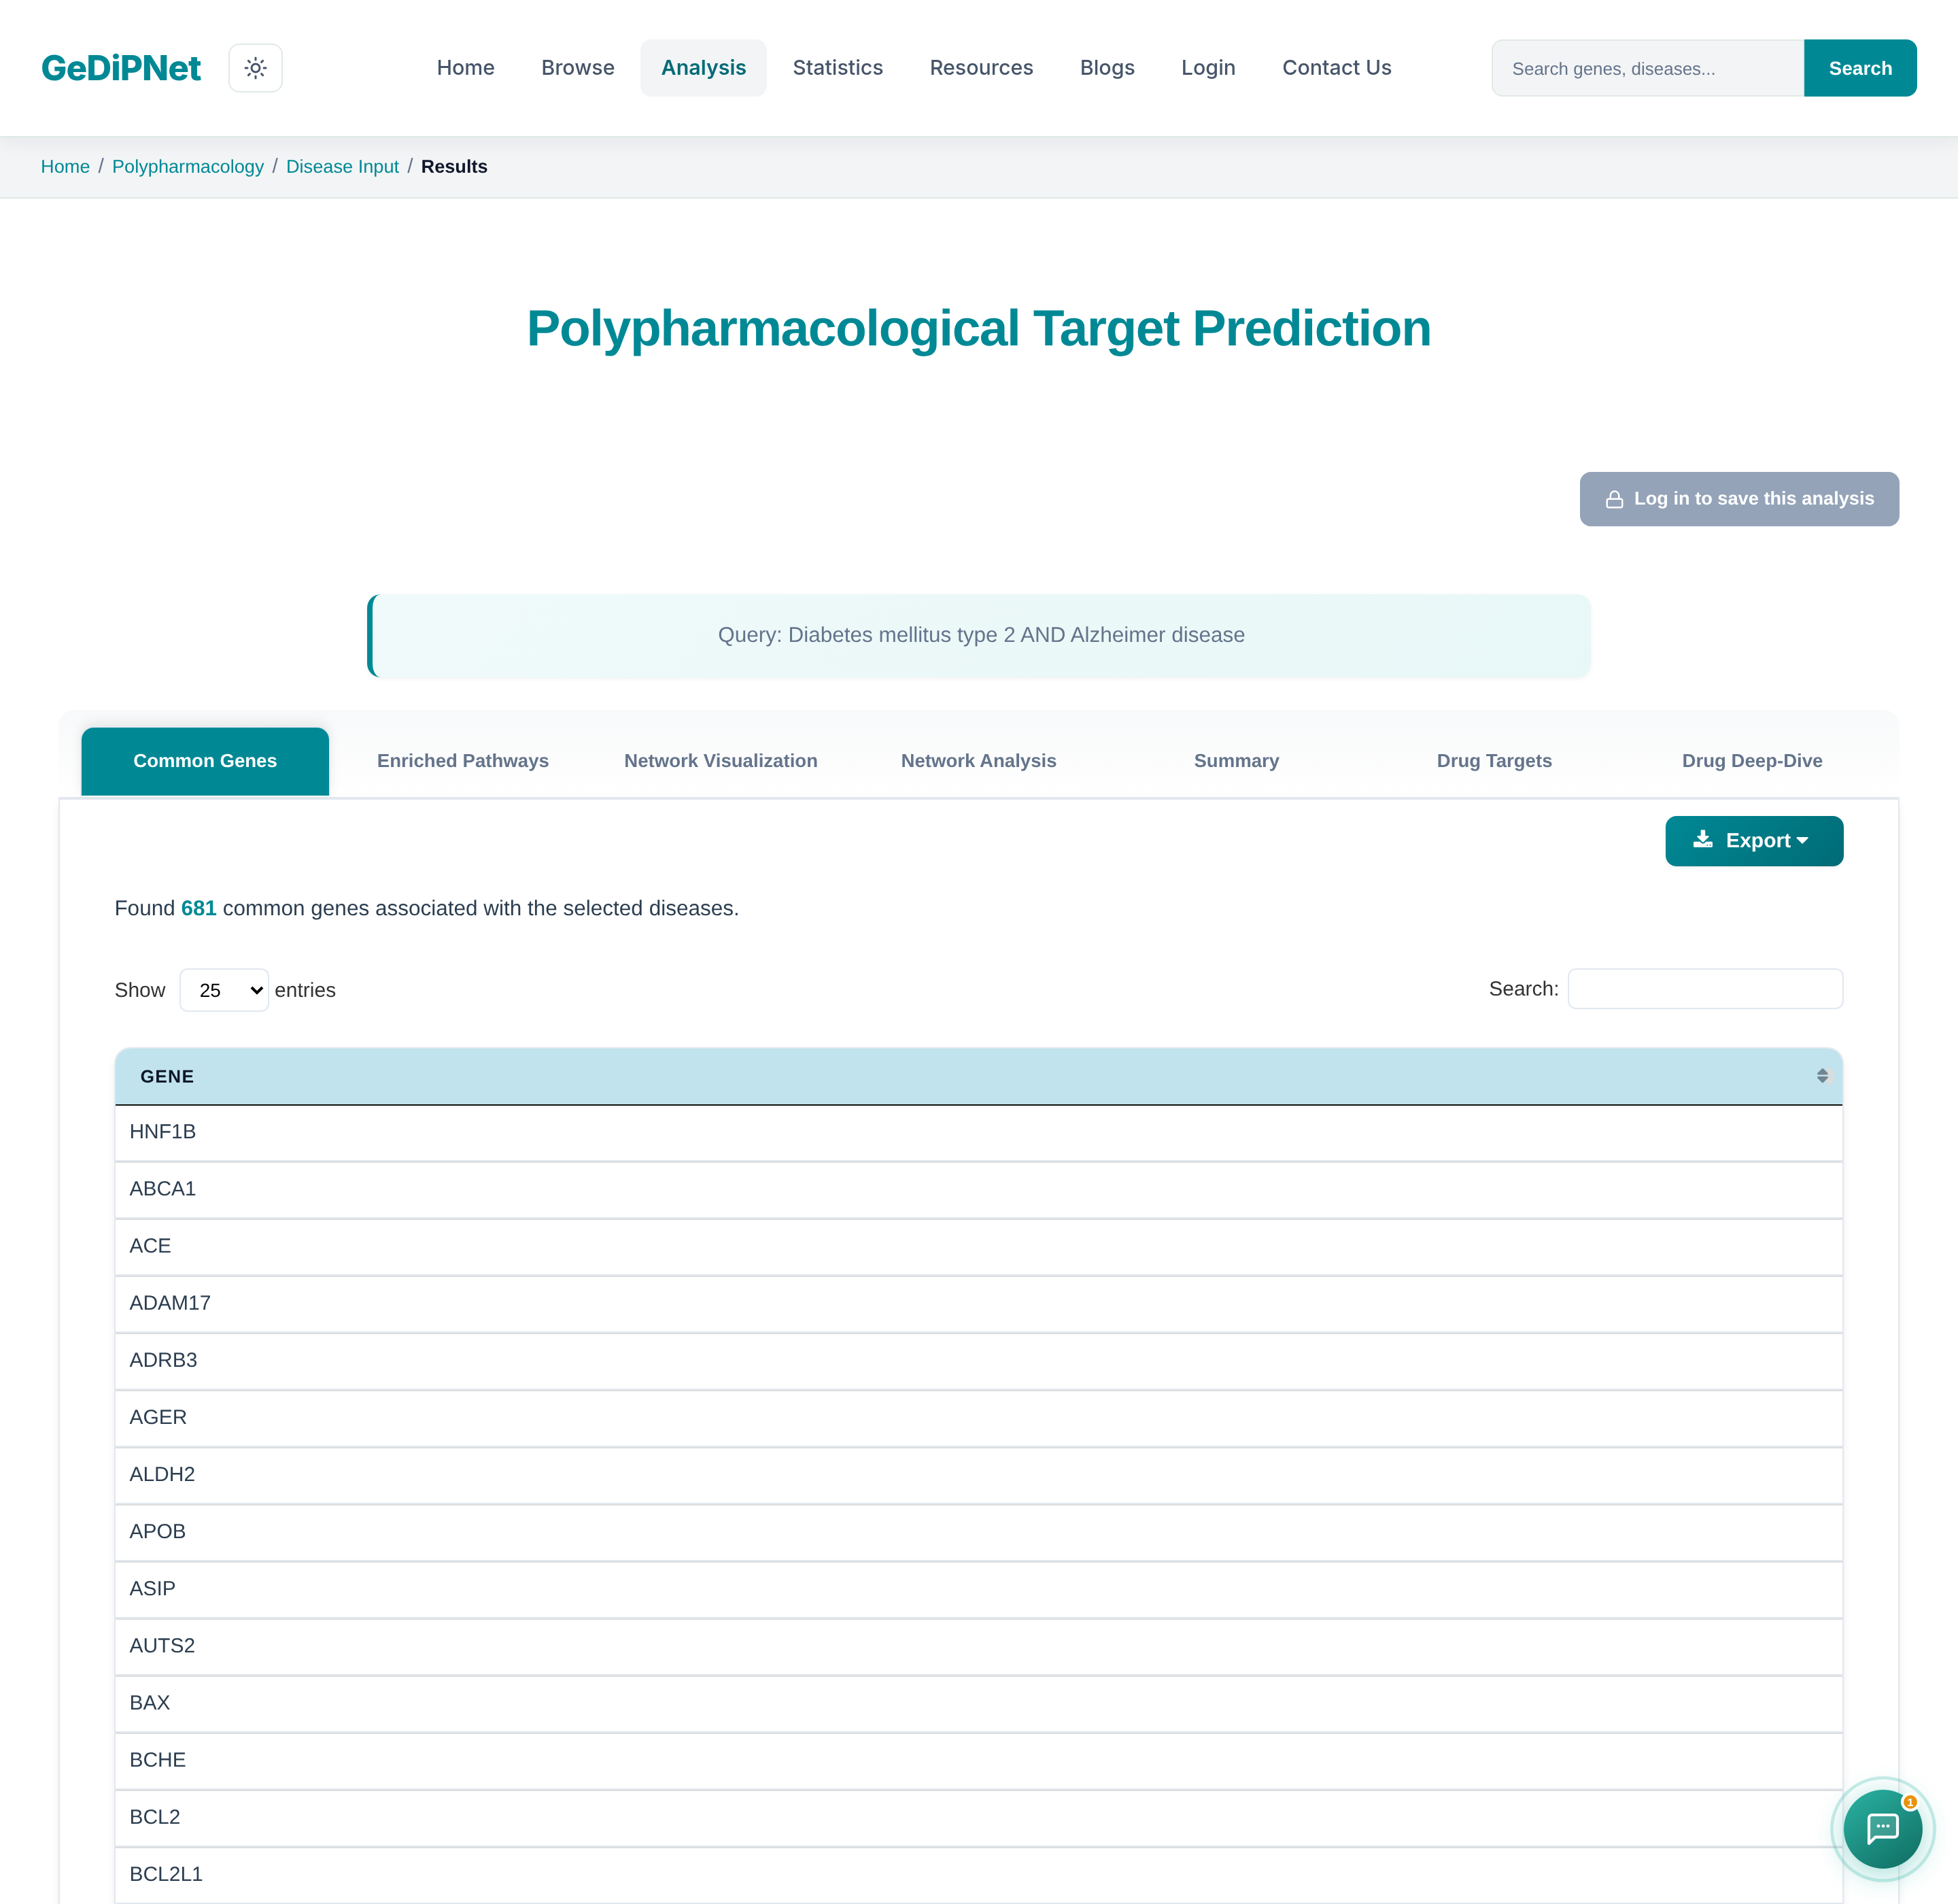
1. Common Genes lists every gene shared across all the diseases (or genes) you selected — 681 for this pair — sortable, searchable, and exportable.
Enriched Pathways lists the KEGG pathways your common genes are significantly concentrated in — those with a Benjamini–Hochberg adjusted p-value (q-value) below 0.05 — showing each pathway's matched genes, hypergeometric p-value, fold enrichment and q-value (see "How to read the statistics" under Enrichment Analysis). This pathway list is also what the Network Visualization, Network Analysis and Summary tabs are built from. In Version 1, a Show previous-method list switch displays the list as this tab showed it under the previous method, for tracing earlier results only.
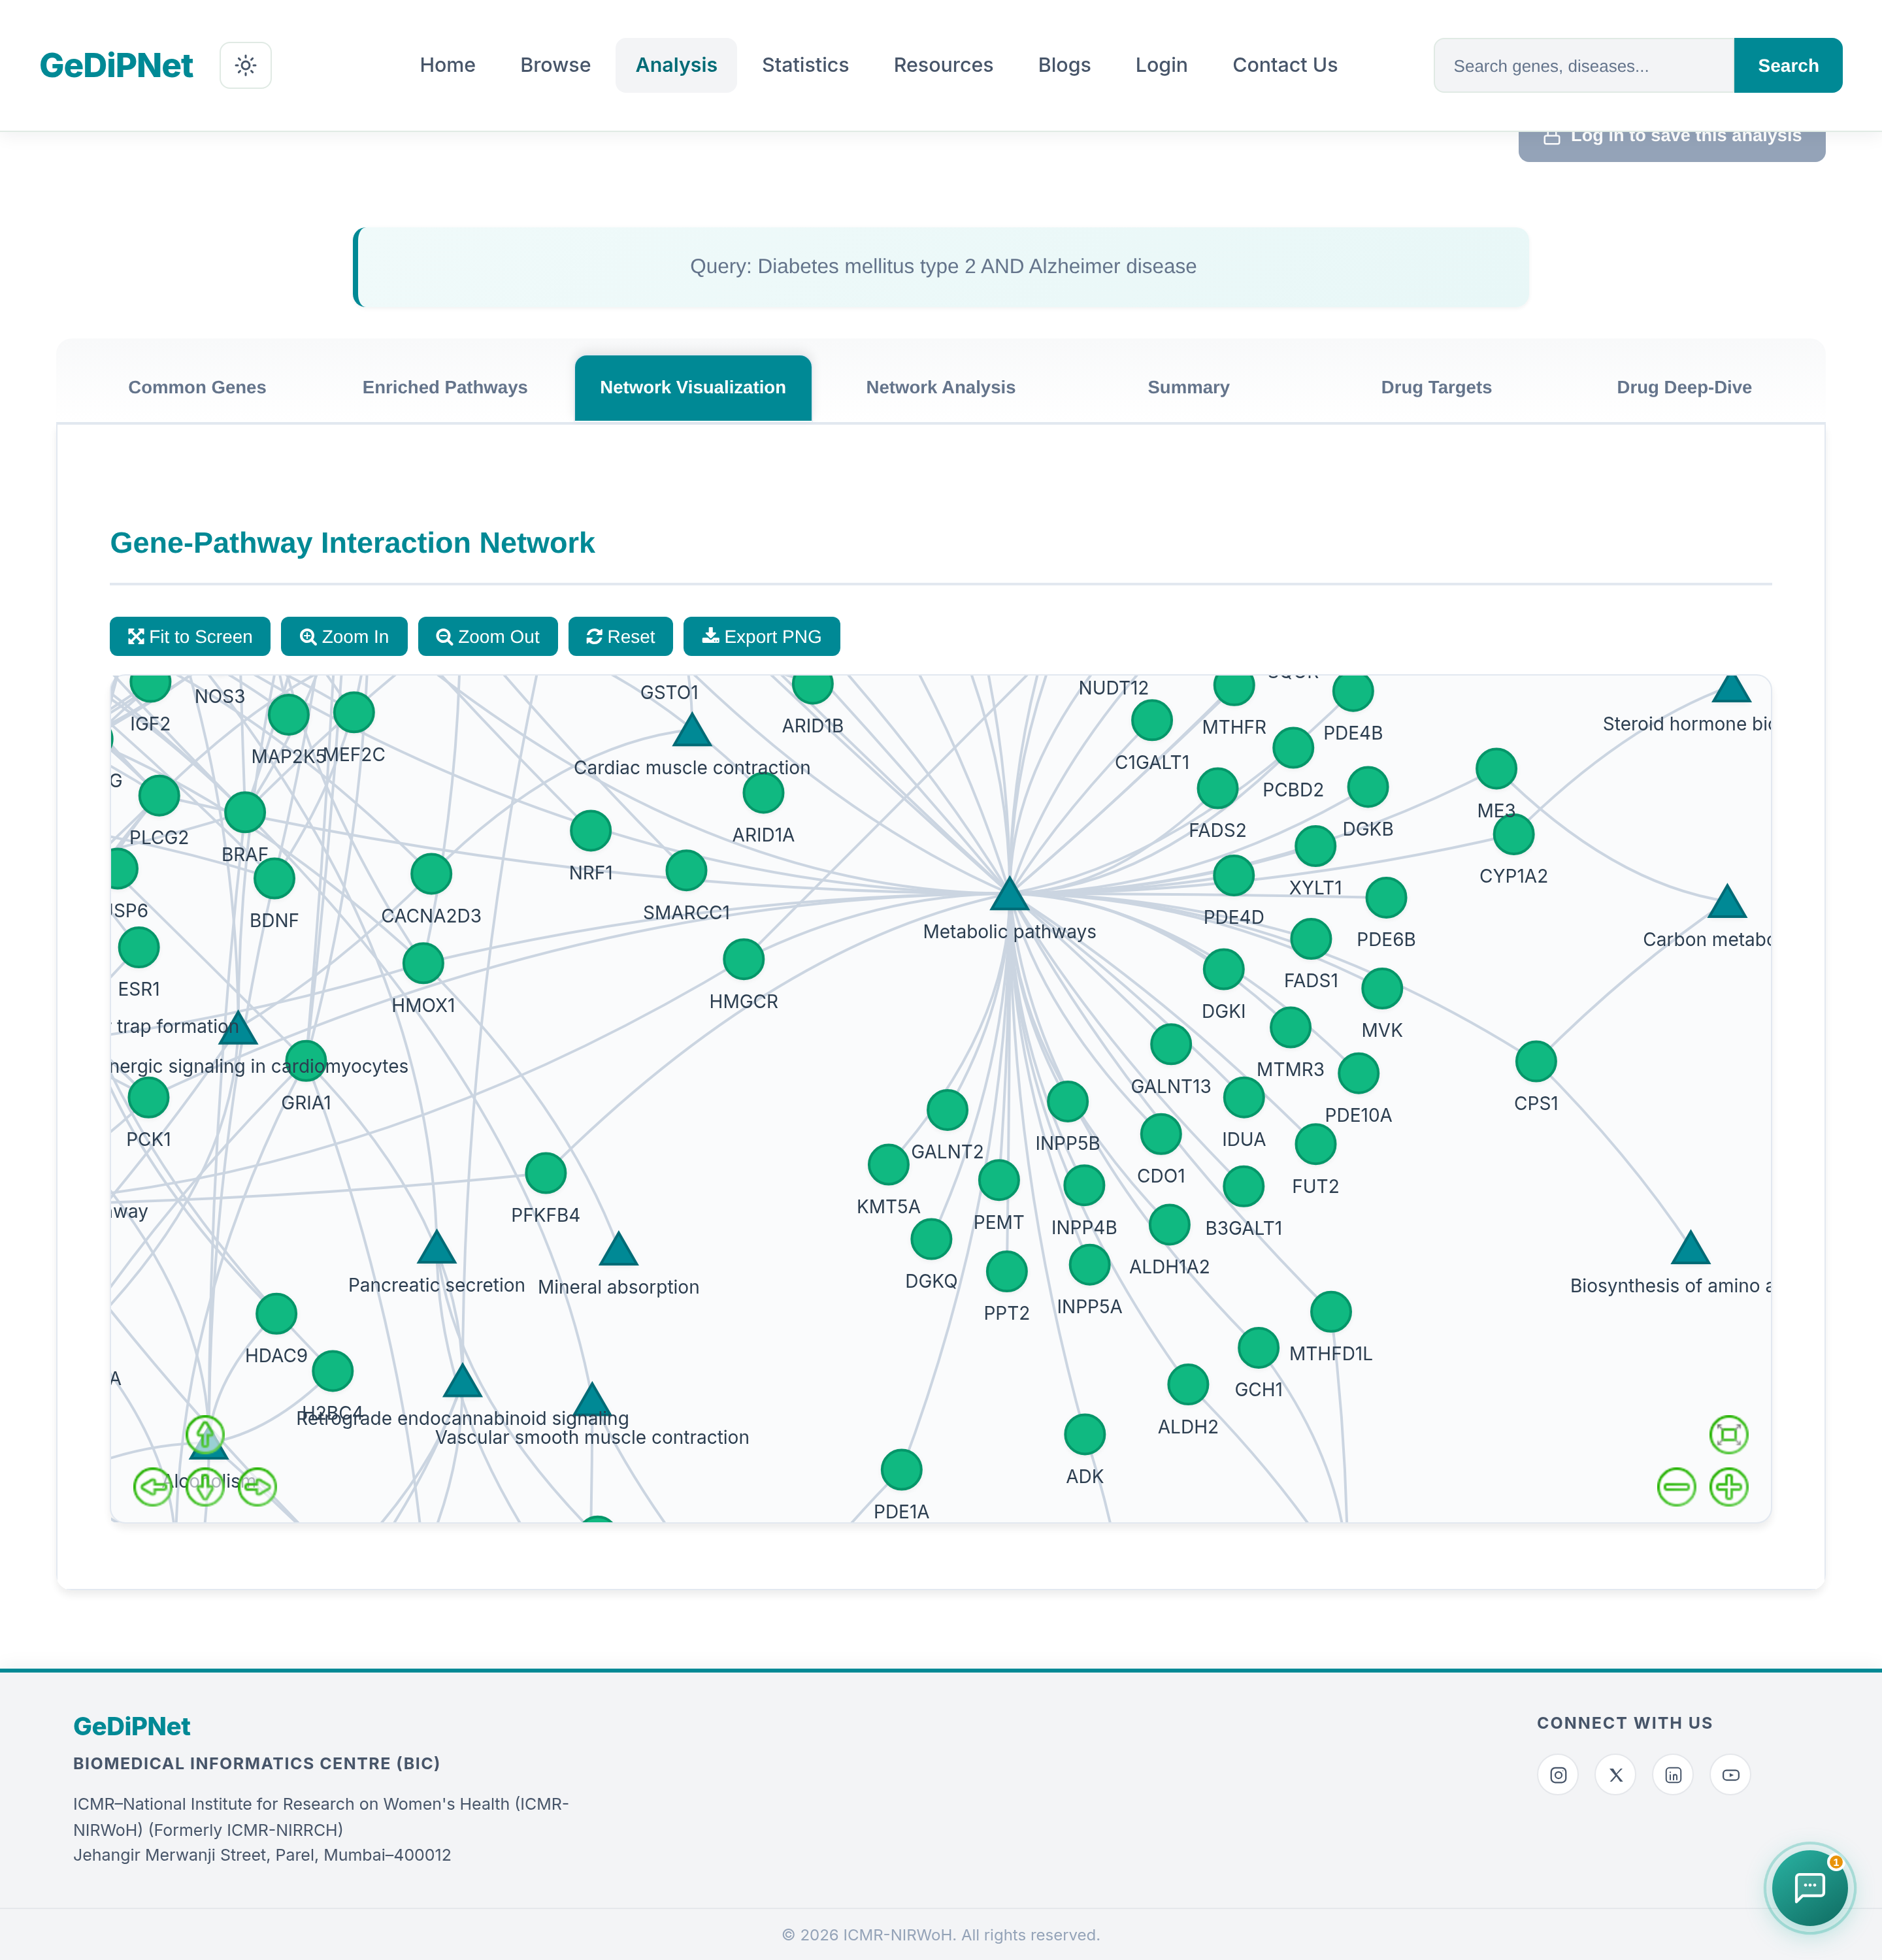
2. Network Visualization draws the gene-pathway interaction network directly, with Fit to Screen, Zoom, Reset, and Export PNG controls.
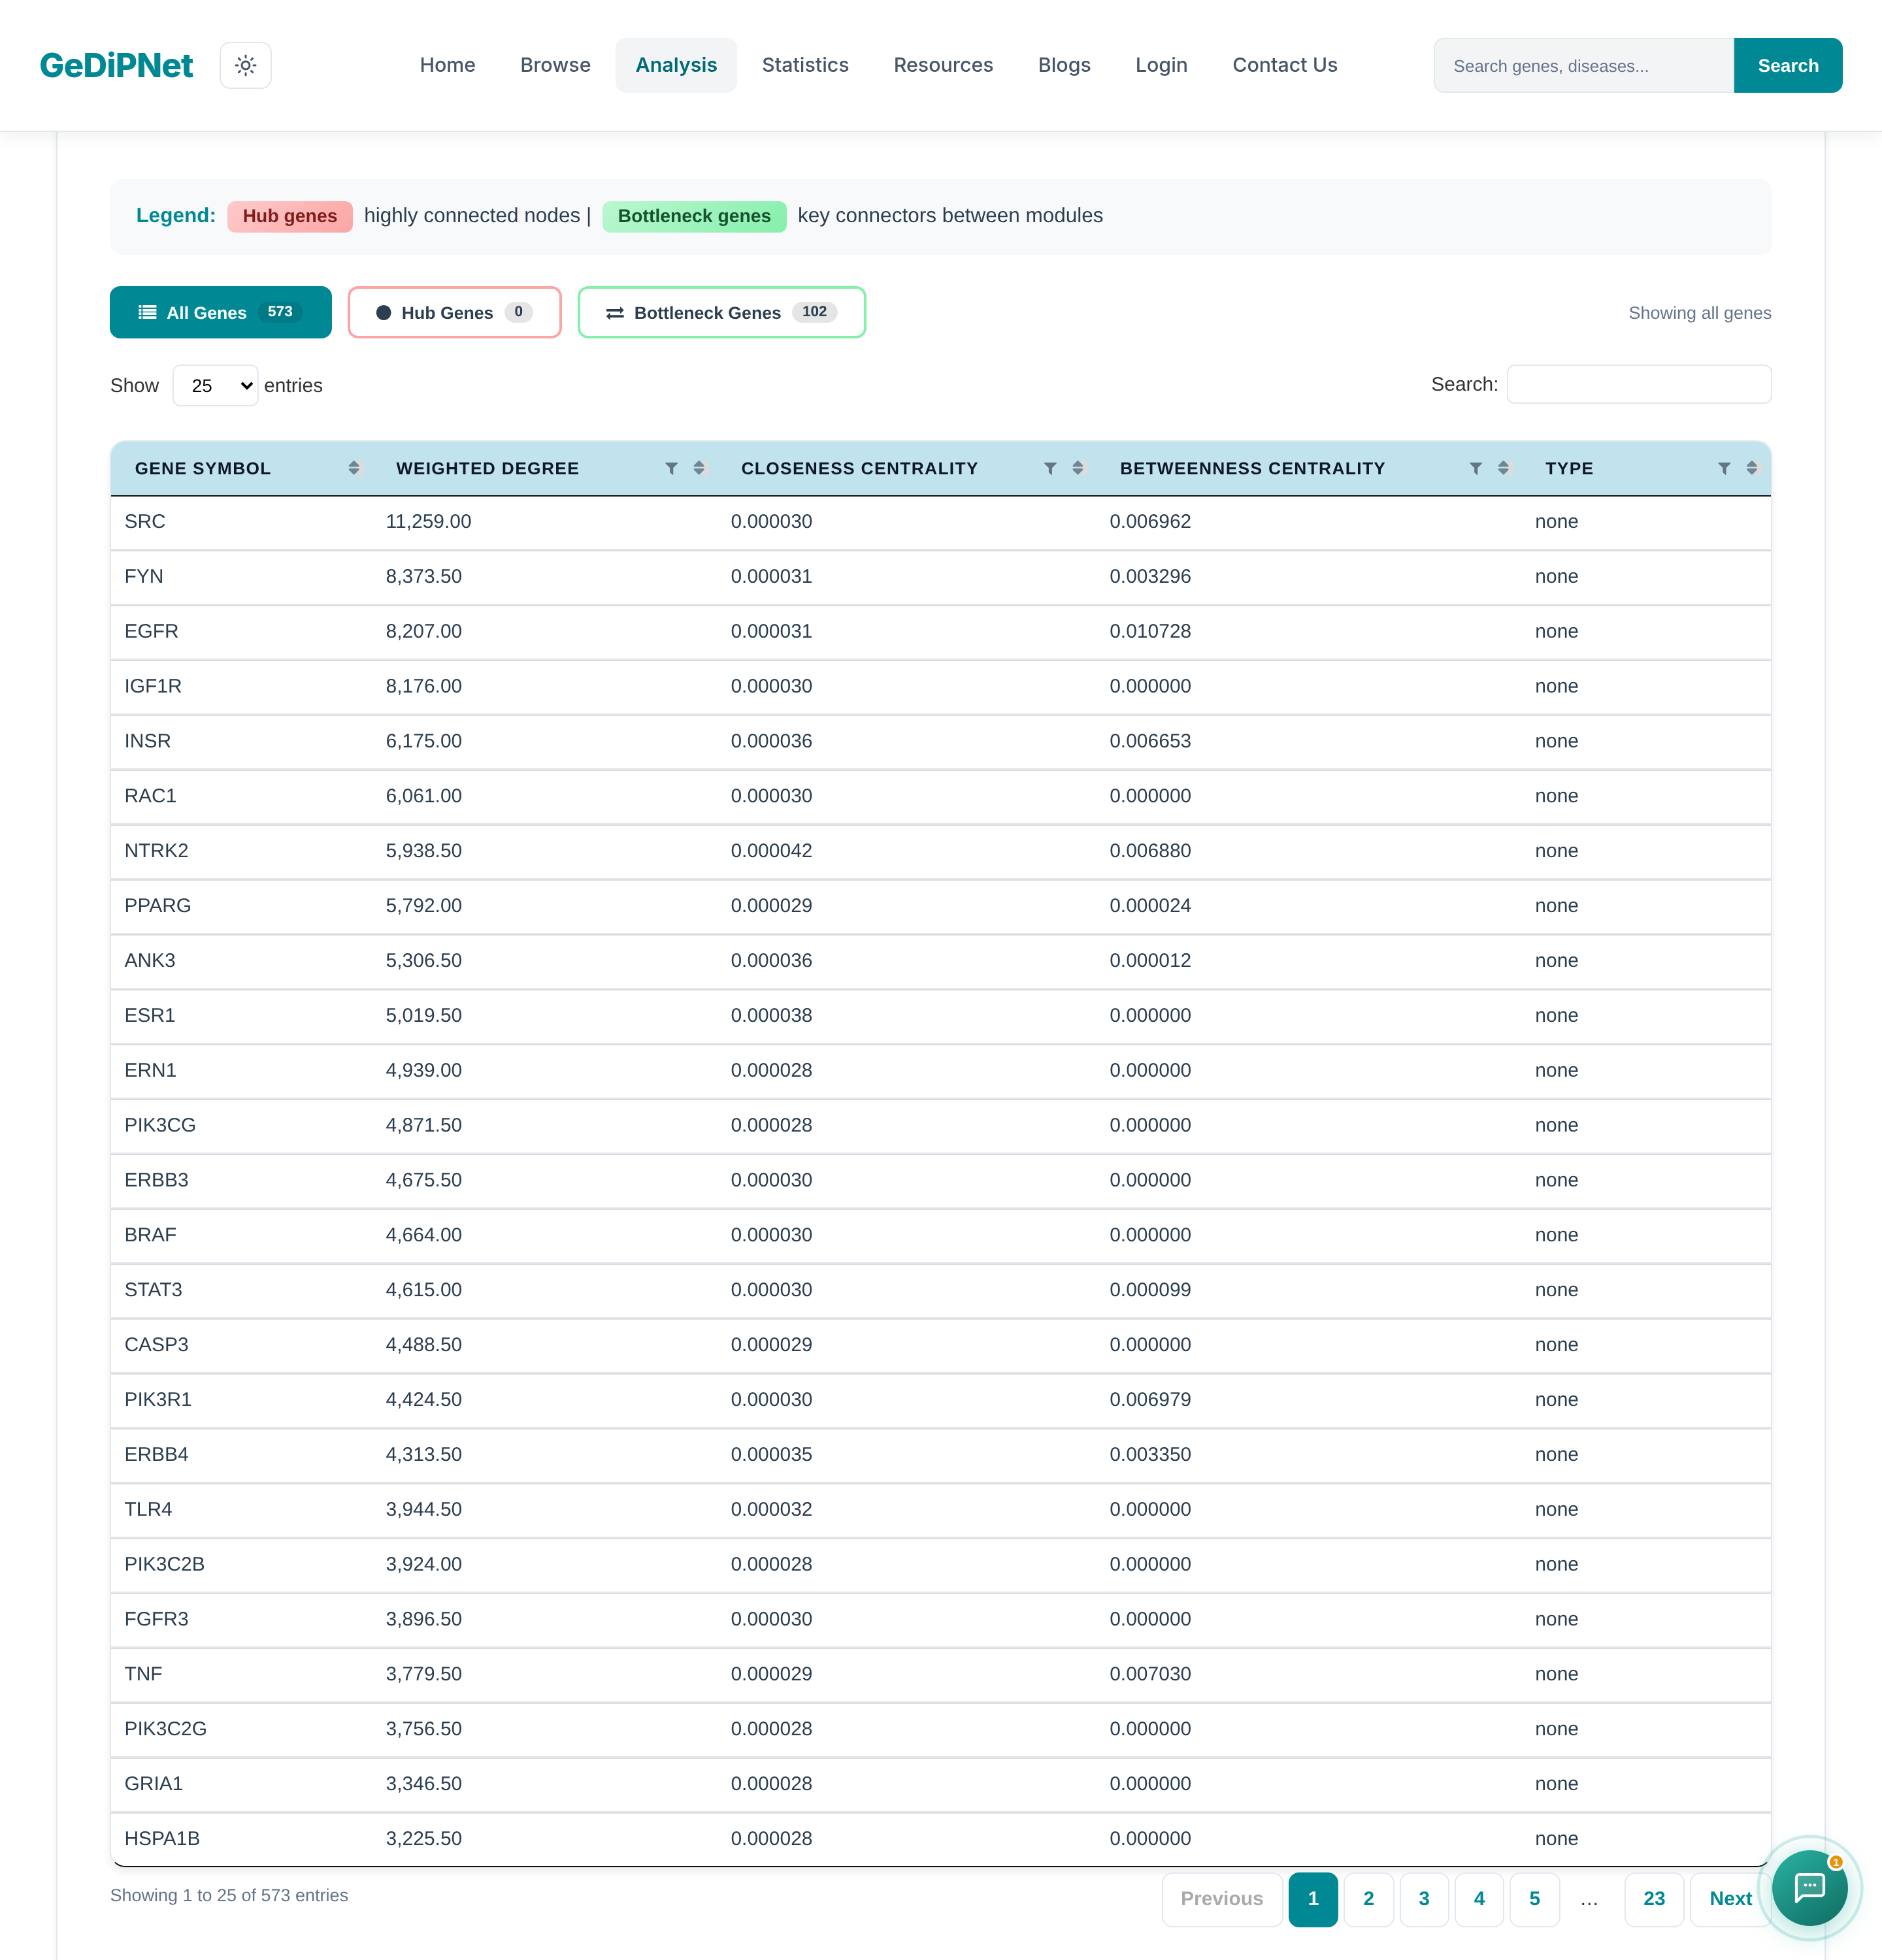
3. Network Analysis scores every gene in the network by weighted degree, closeness centrality, and betweenness centrality, and flags Hub genes (highly connected nodes) and Bottleneck genes (key connectors between modules) — filterable via the All Genes / Hub Genes / Bottleneck Genes buttons above the table.
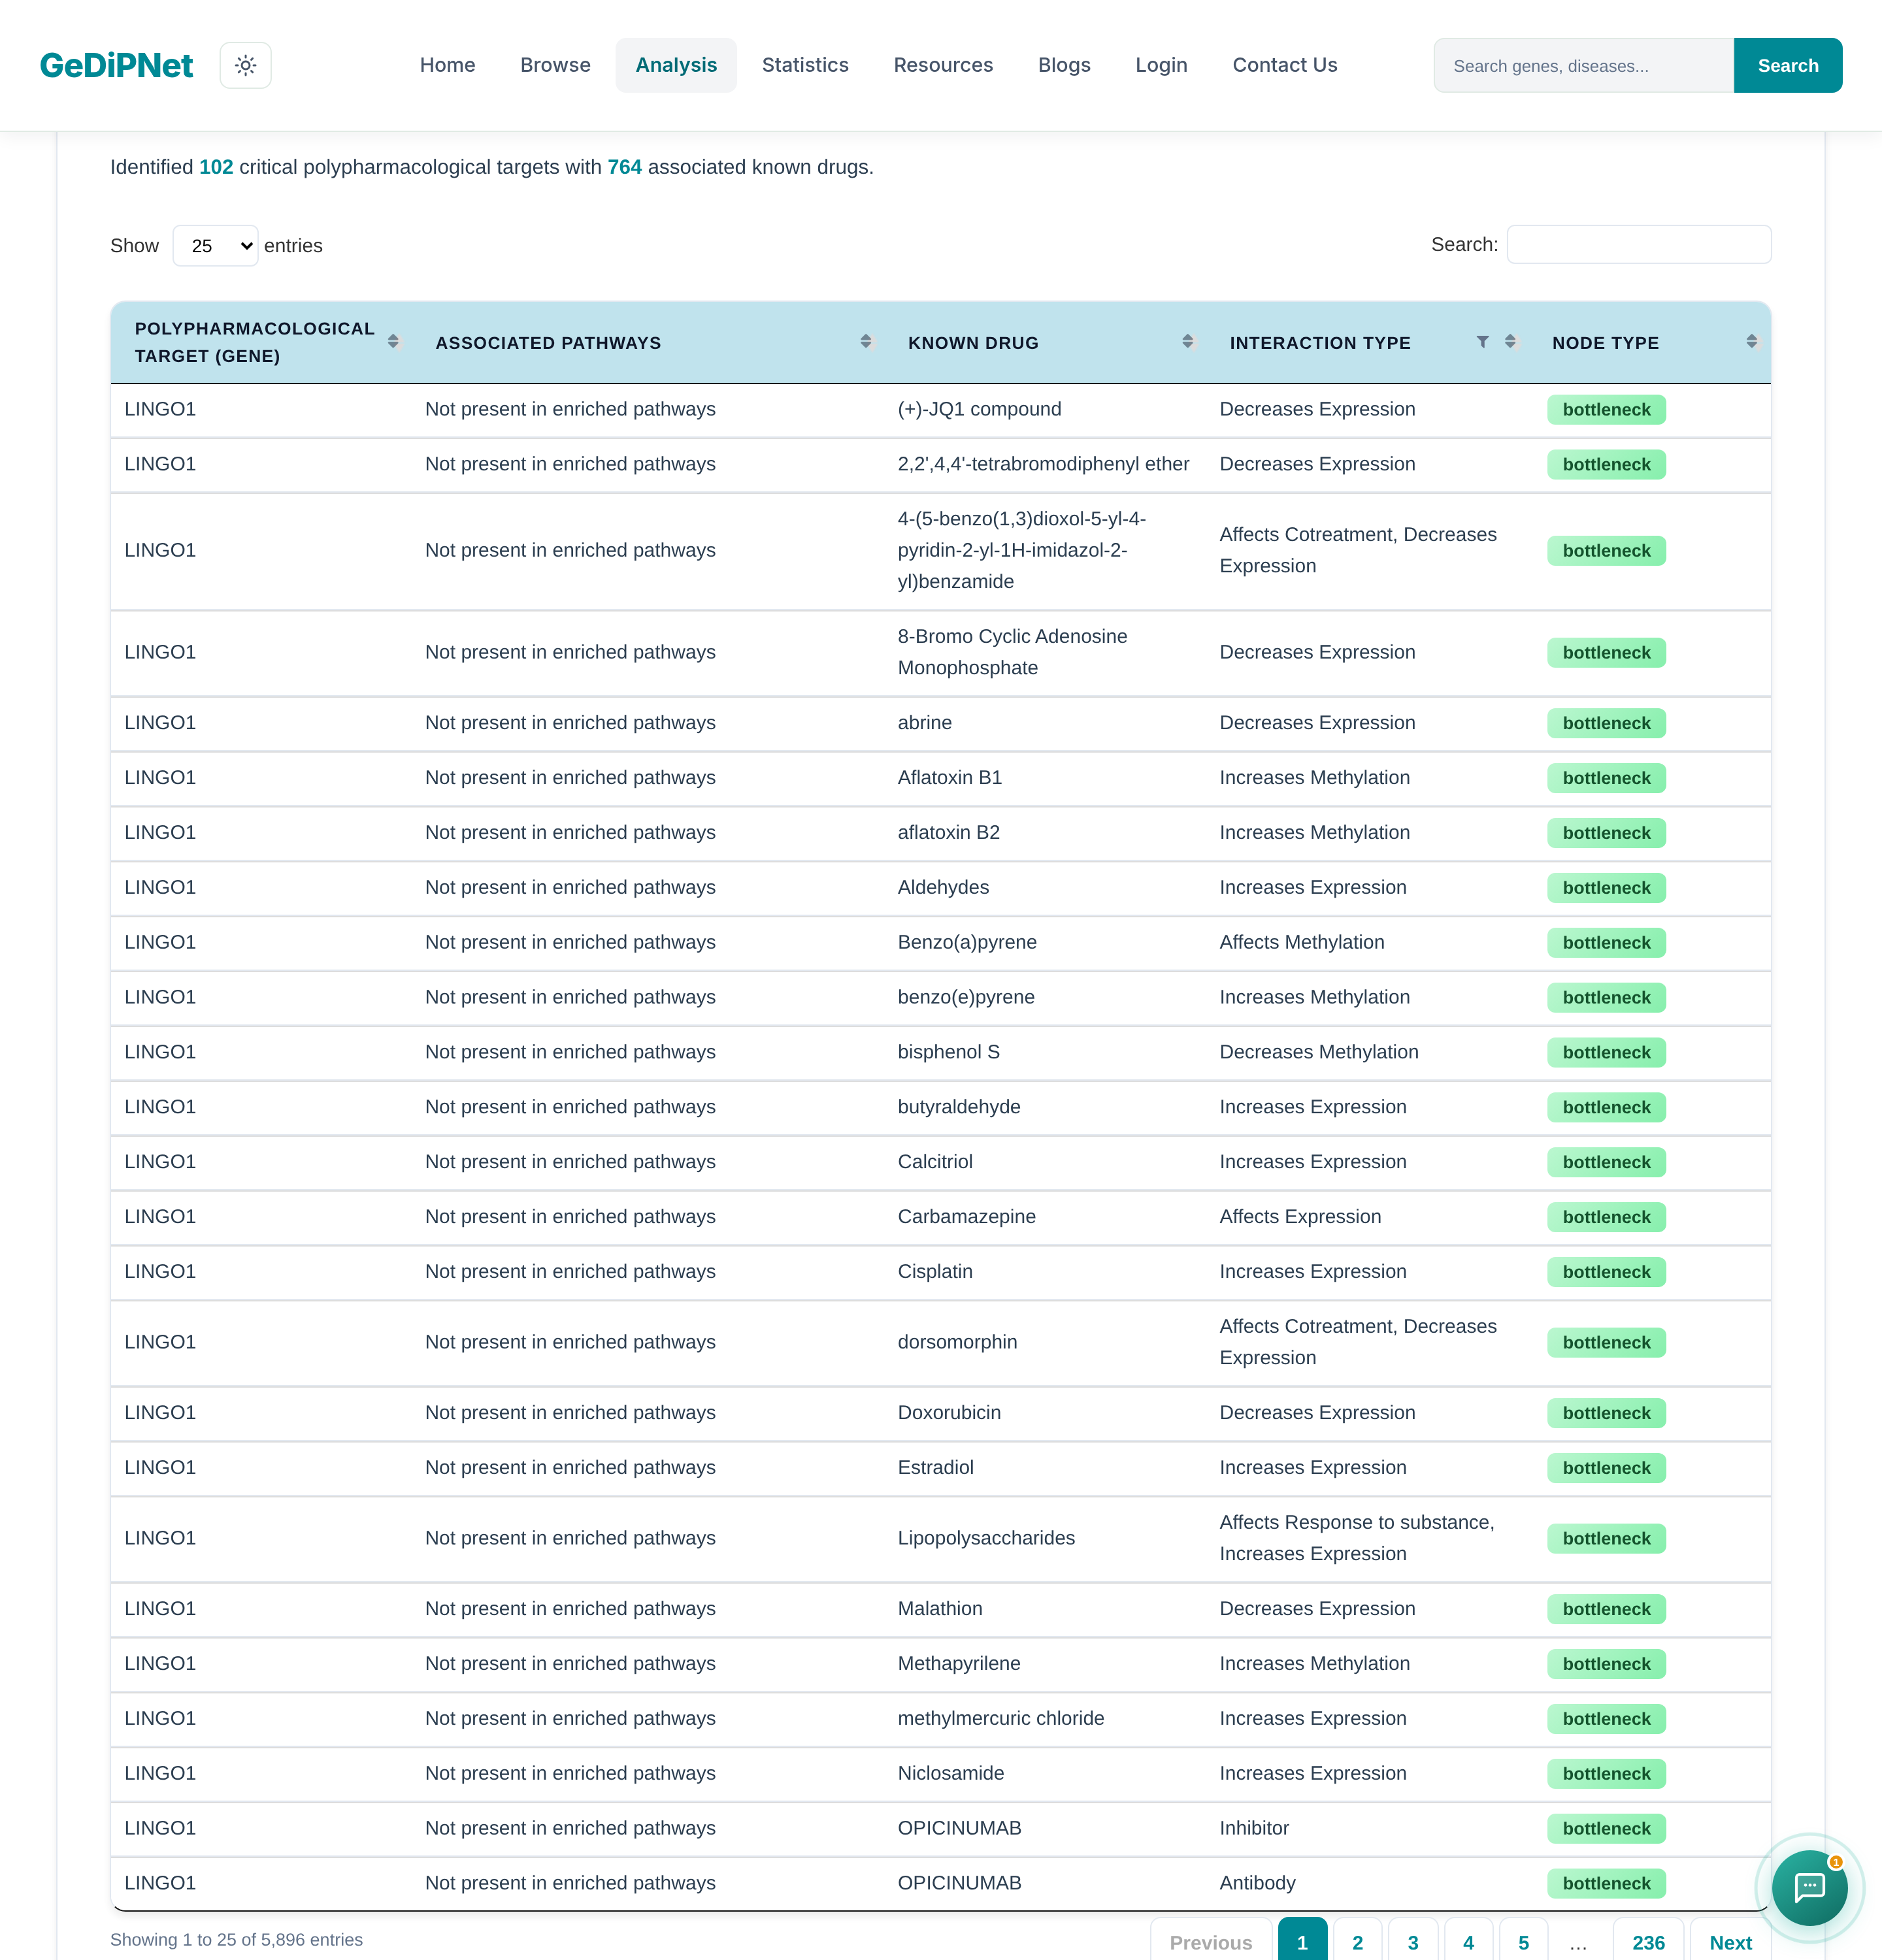
4. Summary narrows the network down to the critical polypharmacological targets — 102 for this pair, with 764 associated known drugs — each row showing the target gene, its associated pathways, a known drug, the interaction type, and whether it's a hub or bottleneck node.
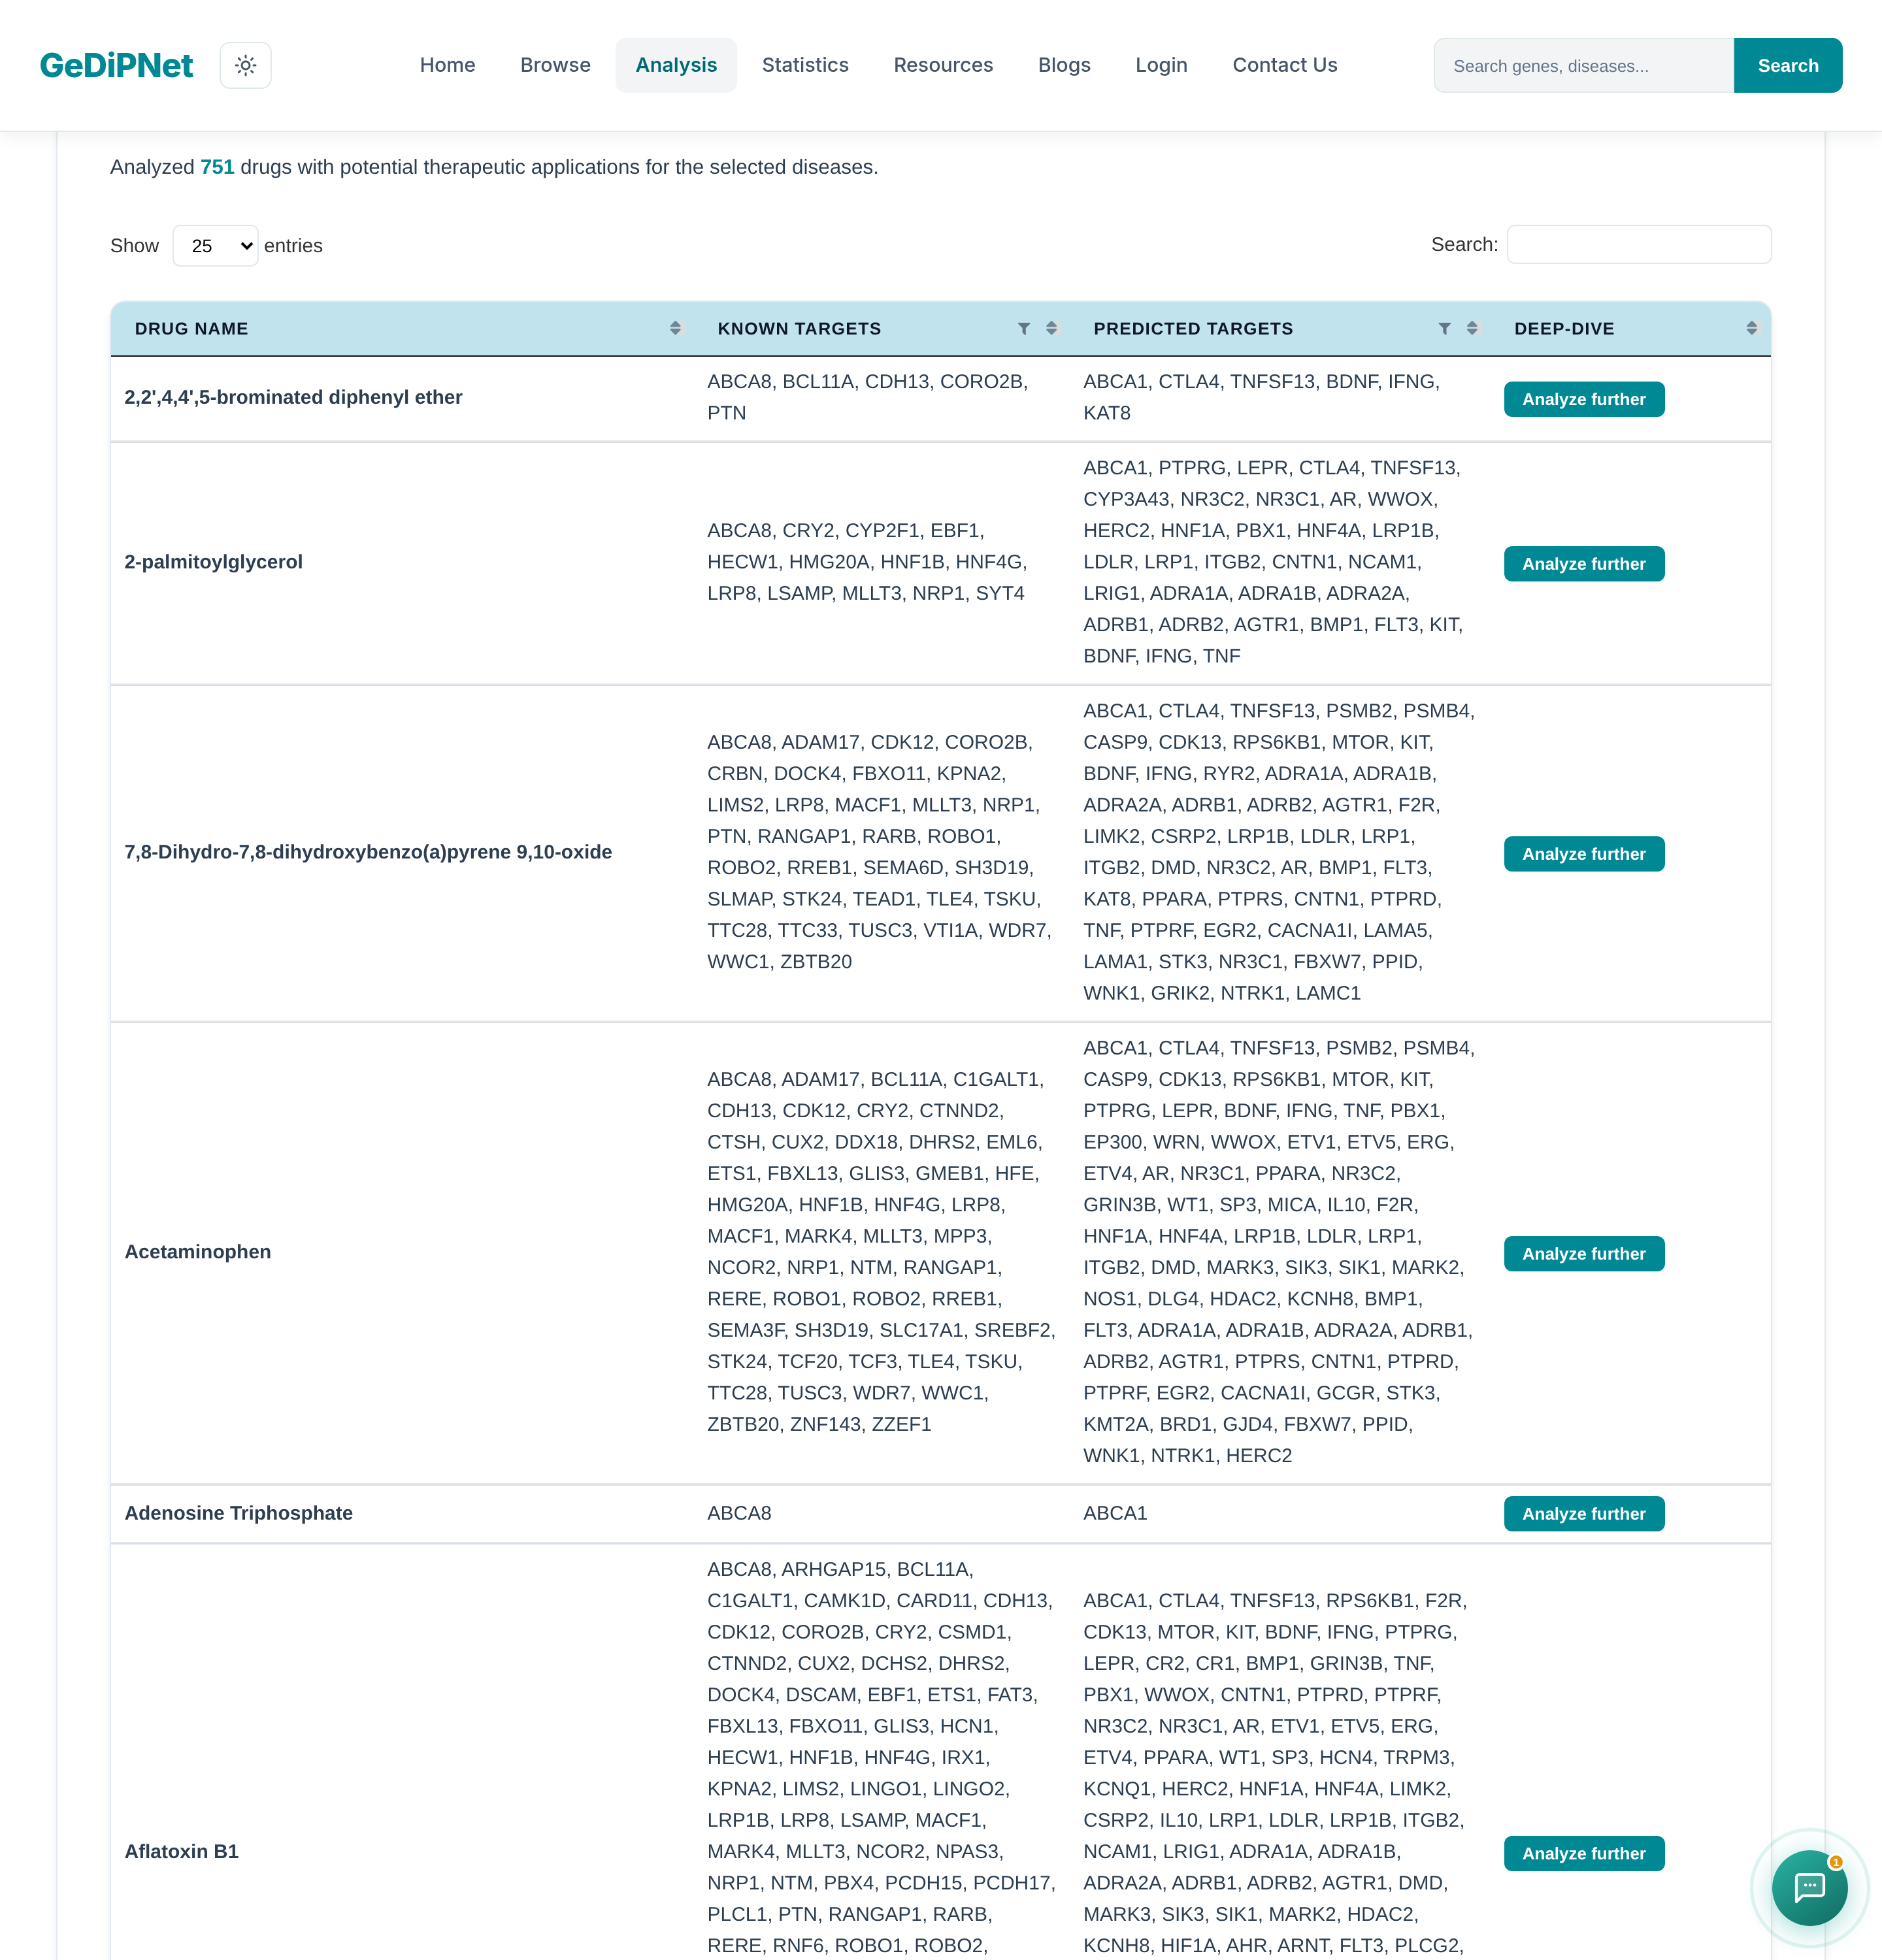
5. Drug Targets flips the view around: one row per drug (751 analyzed here), showing its known targets, its predicted targets from this network, and an "Analyze further" button that opens that specific drug in the Drug Deep-Dive tab.
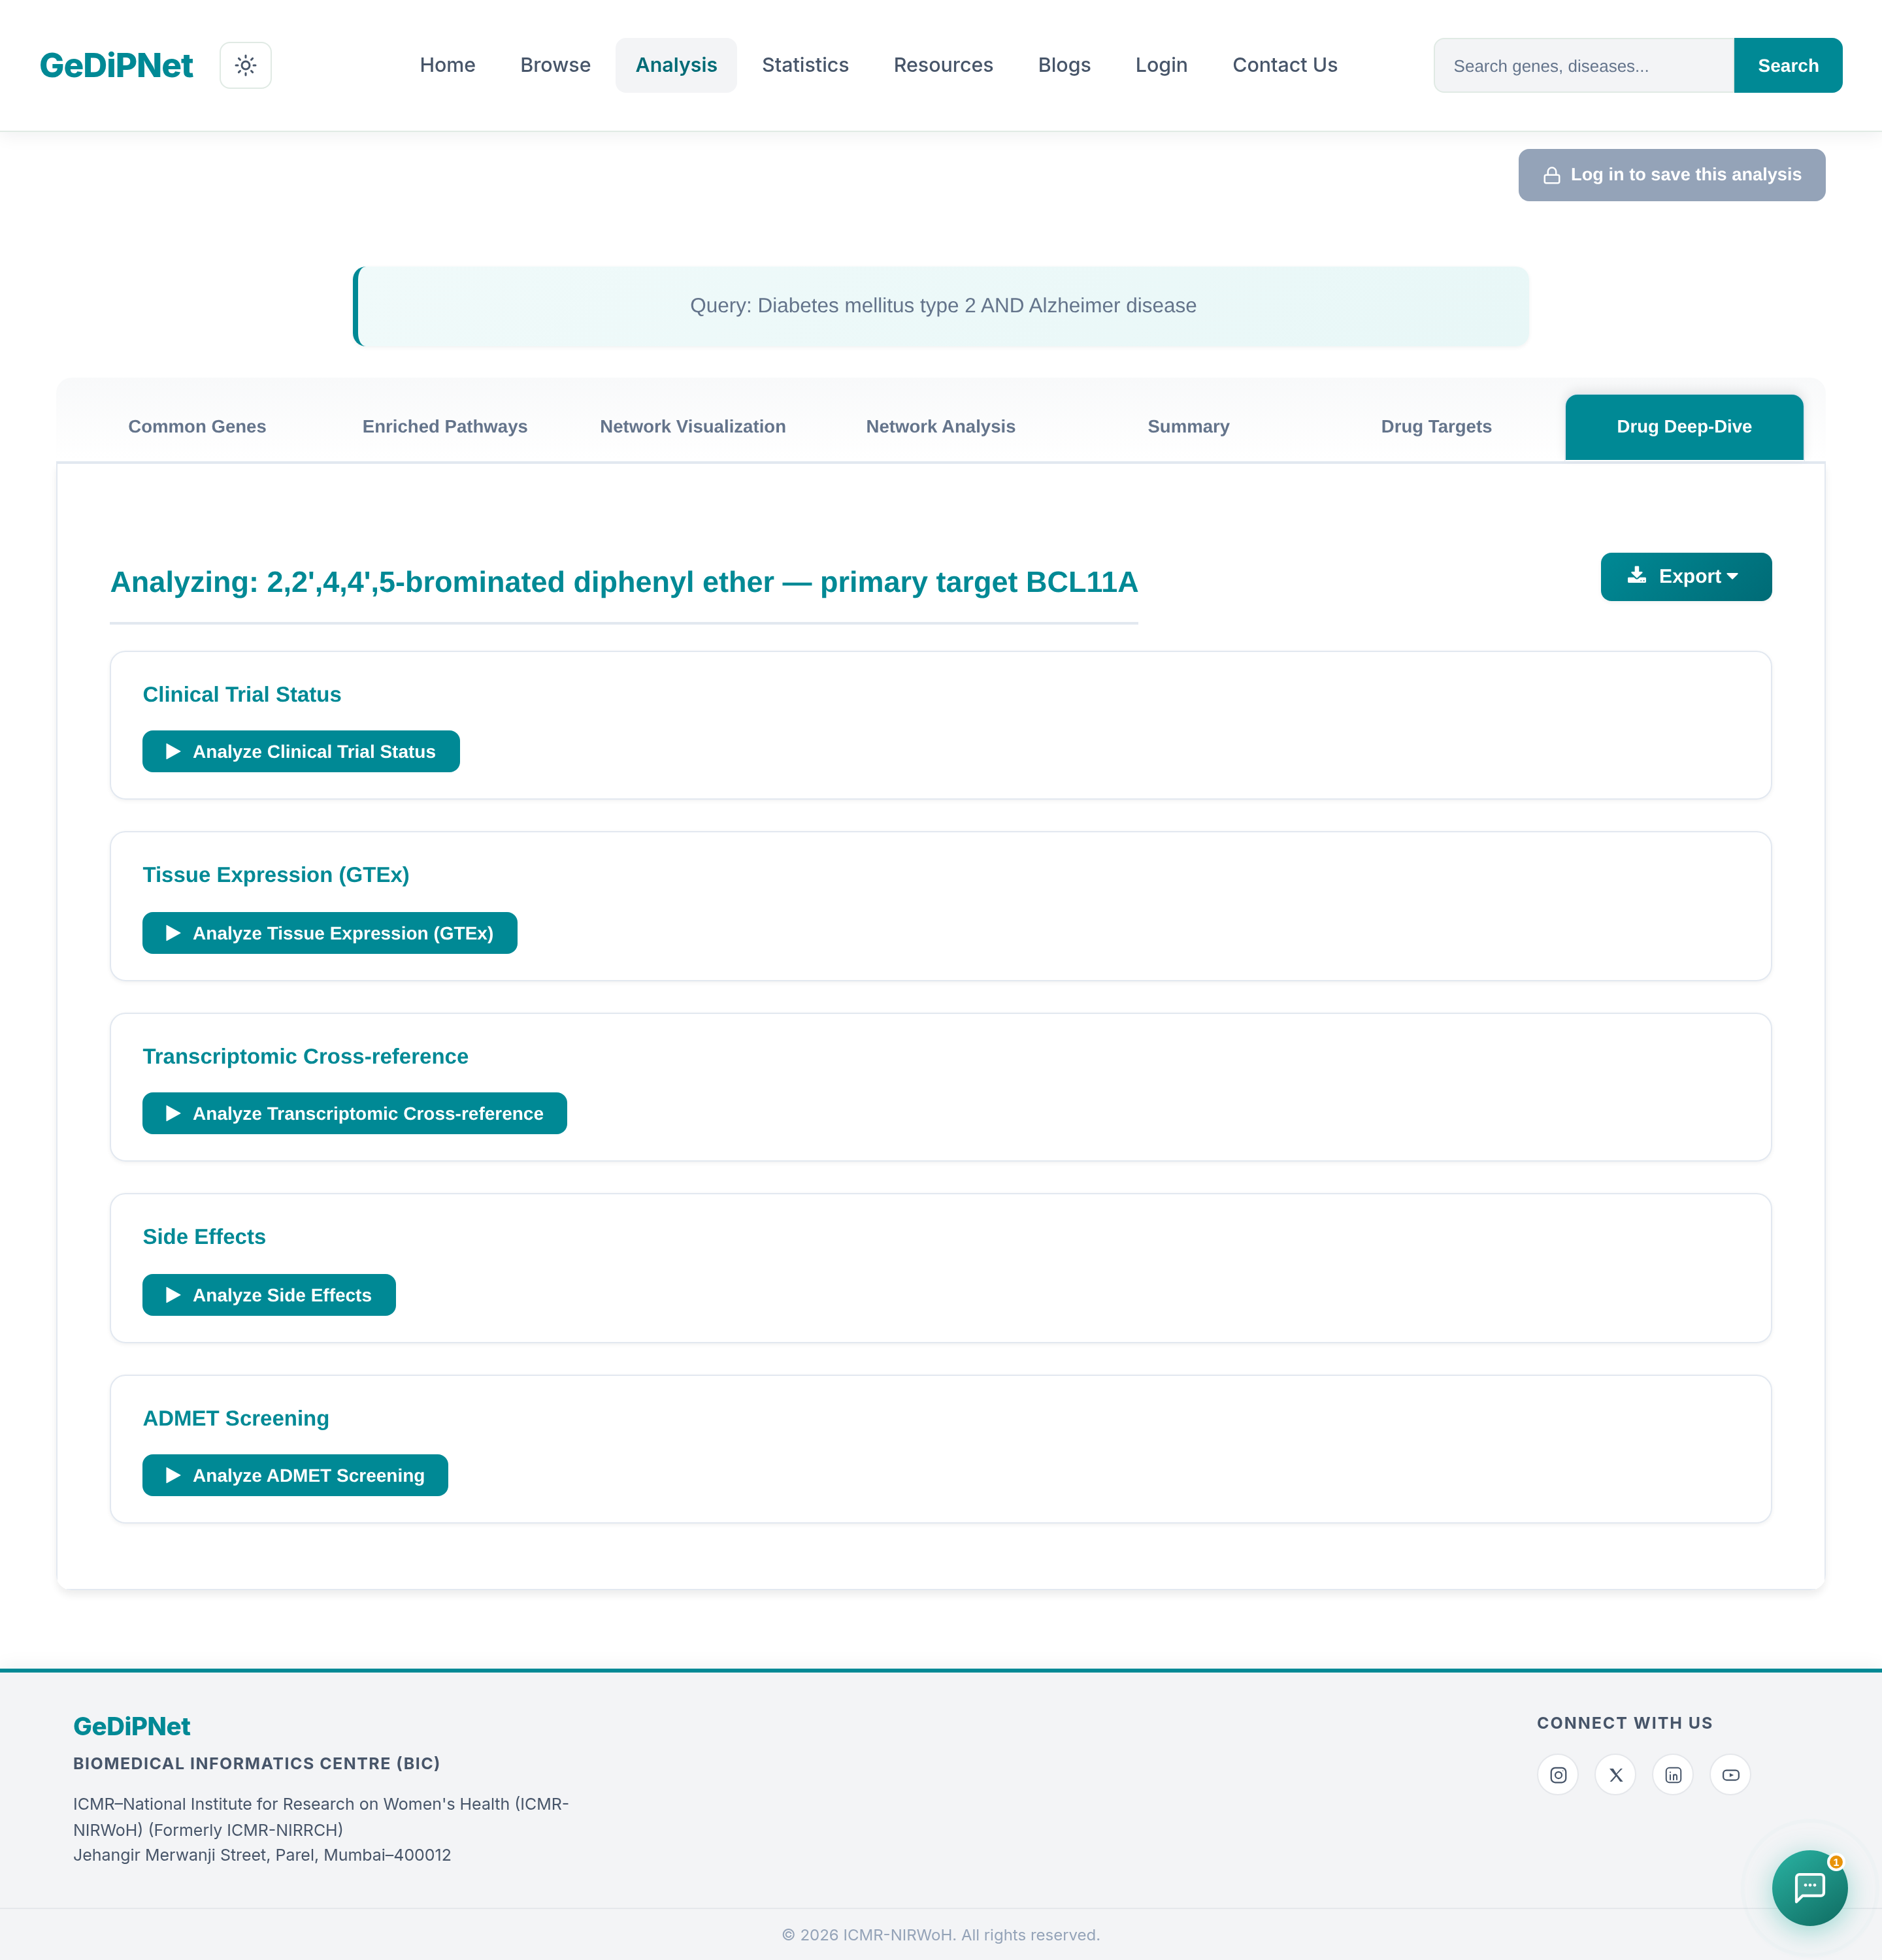
6. Drug Deep-Dive studies one drug/target pair in depth across 5 panels, each loading only when you click its own "Analyze" button (so the page doesn't slow down loading all 5 up front): Clinical Trial Status (real ClinicalTrials.gov results), Tissue Expression (GTEx data for the target gene), Transcriptomic Cross-reference (Expression Atlas and, for cancers, TCGA/cBioPortal data), Side Effects (on-label SIDER data plus off-label OFFSIDES signals), and ADMET Screening (absorption/distribution/metabolism/excretion/toxicity predictions, including blood-brain barrier penetration).