Help
Step-by-step user manual: search, browse genes & diseases, pathway analysis, enrichment, comorbidity, and more.
Comorbidity Analysis
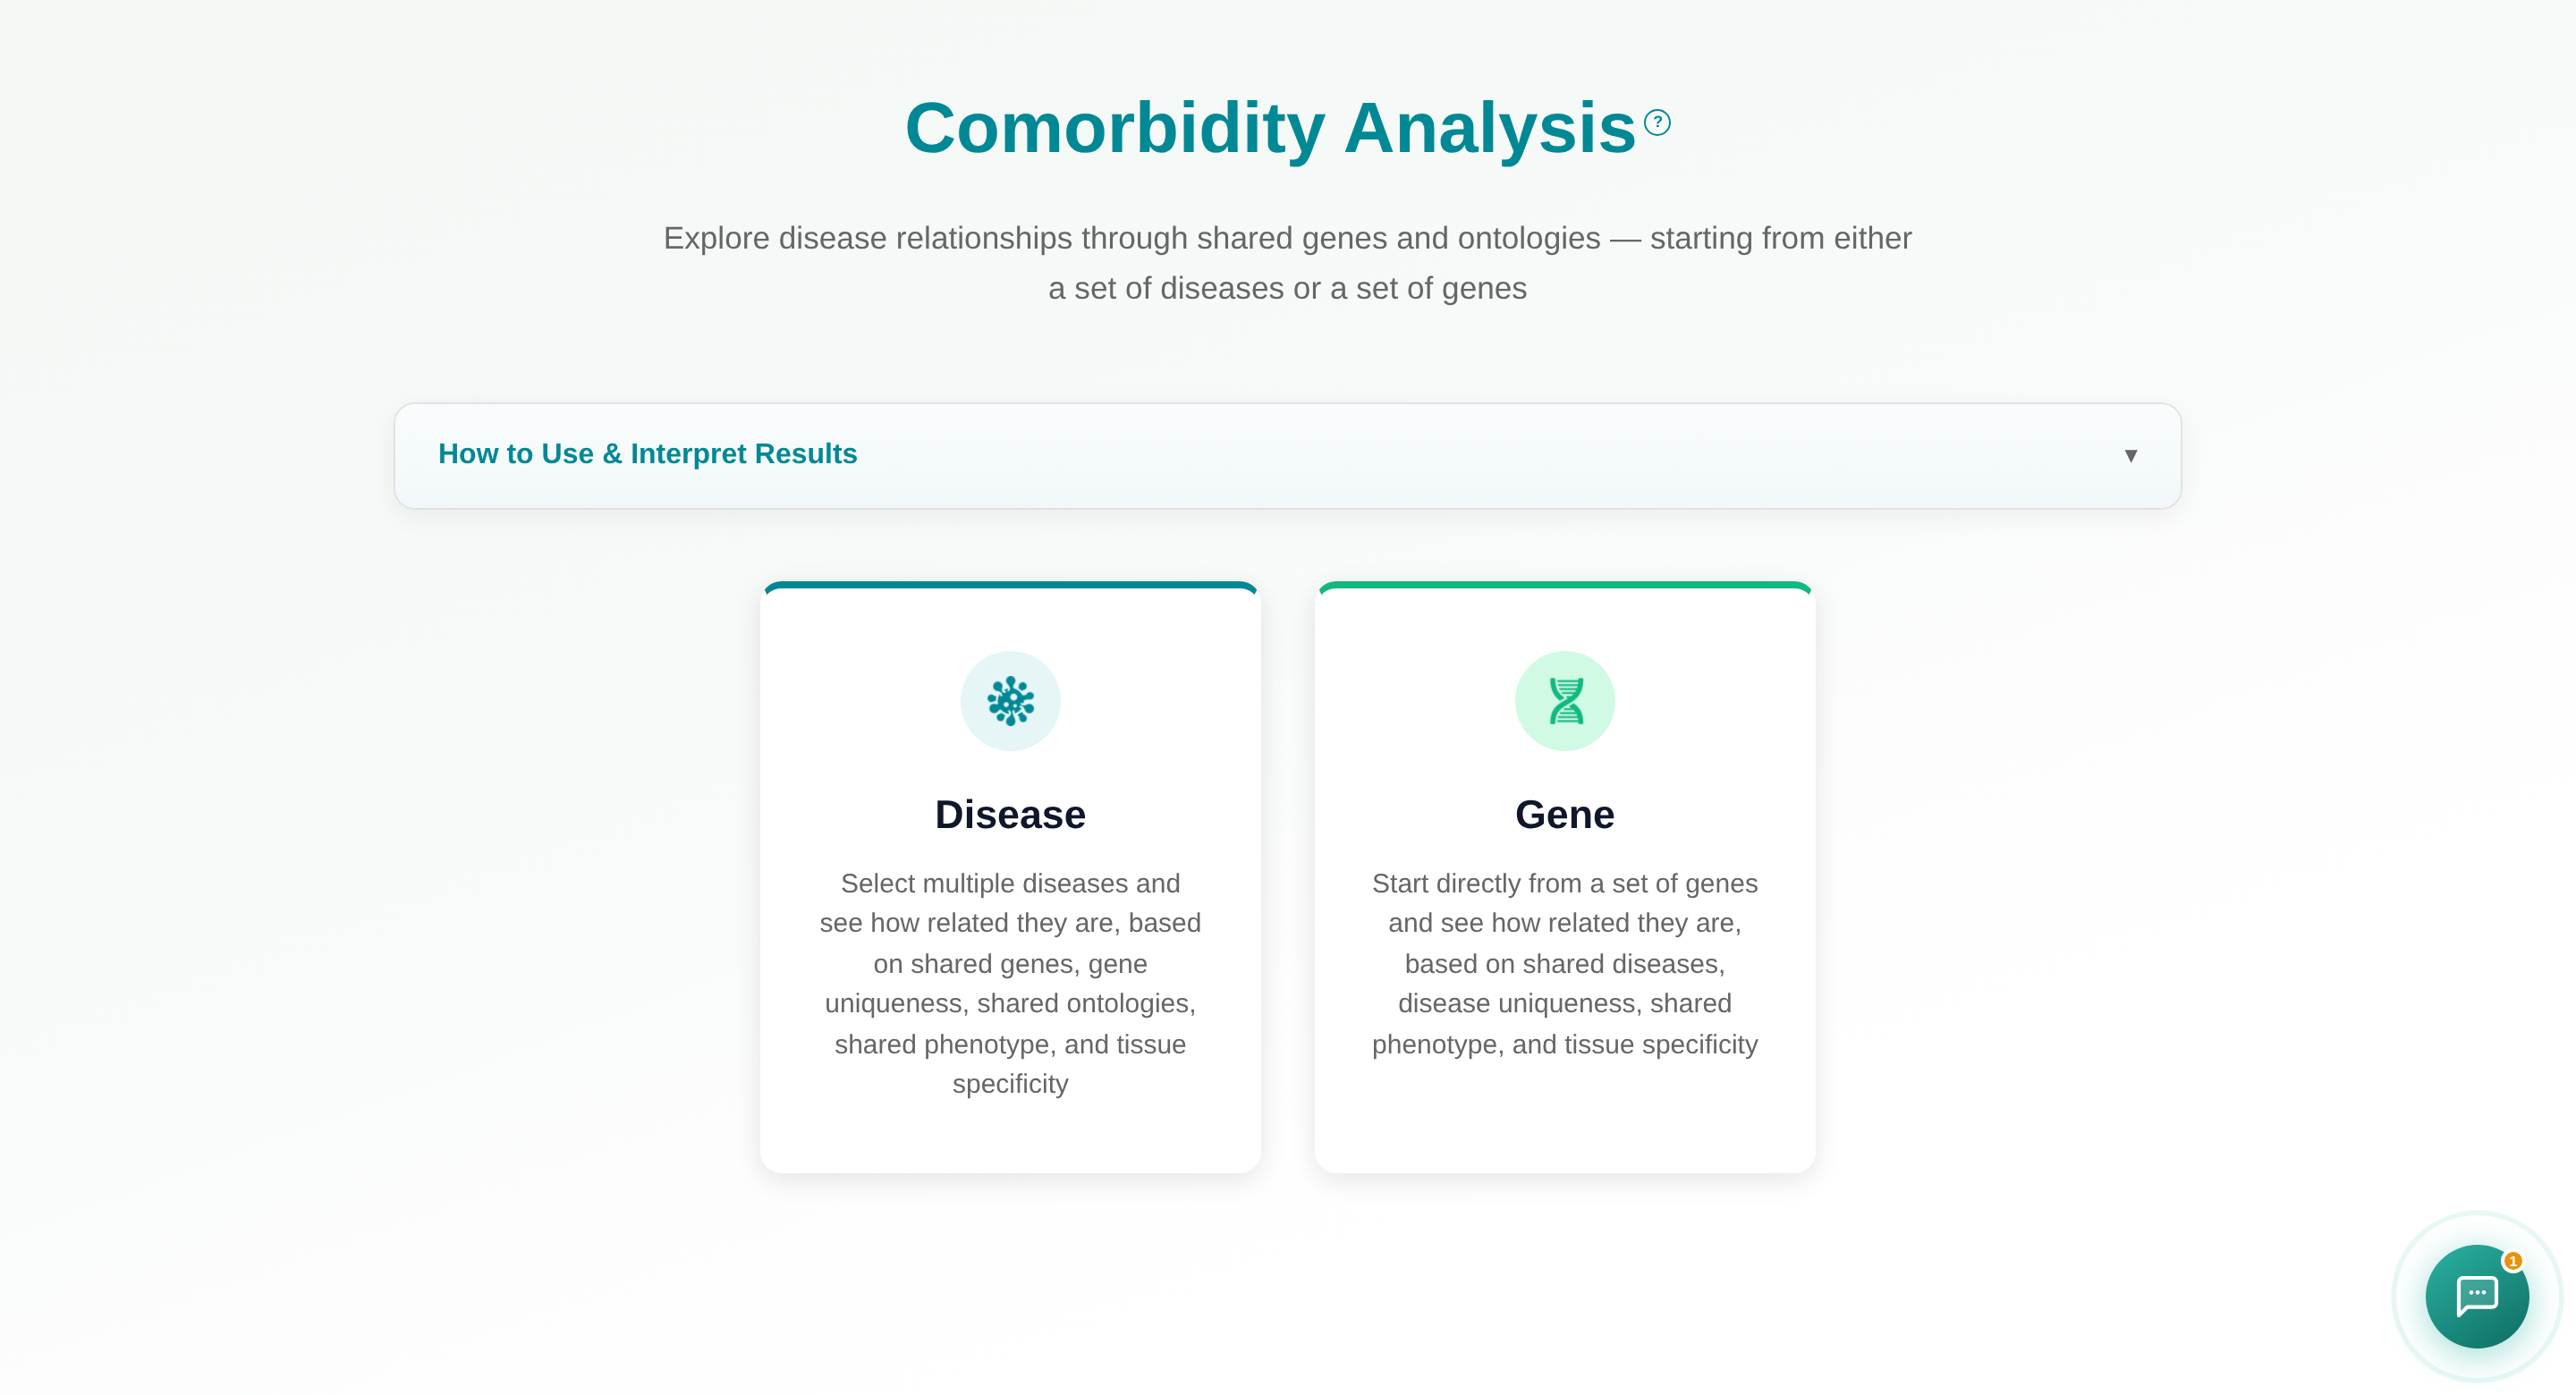
The Comorbidity Analysis hub scores how related two or more diseases (or genes) are likely to be. Choose a Disease entry point (search and move disease names into "Selected Diseases" using the → button, or double-click; use ← to remove one) or a Gene entry point to start directly from a set of genes. Pick a dataset — Curated (faster) or Curated + Text Mining (broader coverage, slower) — and submit.
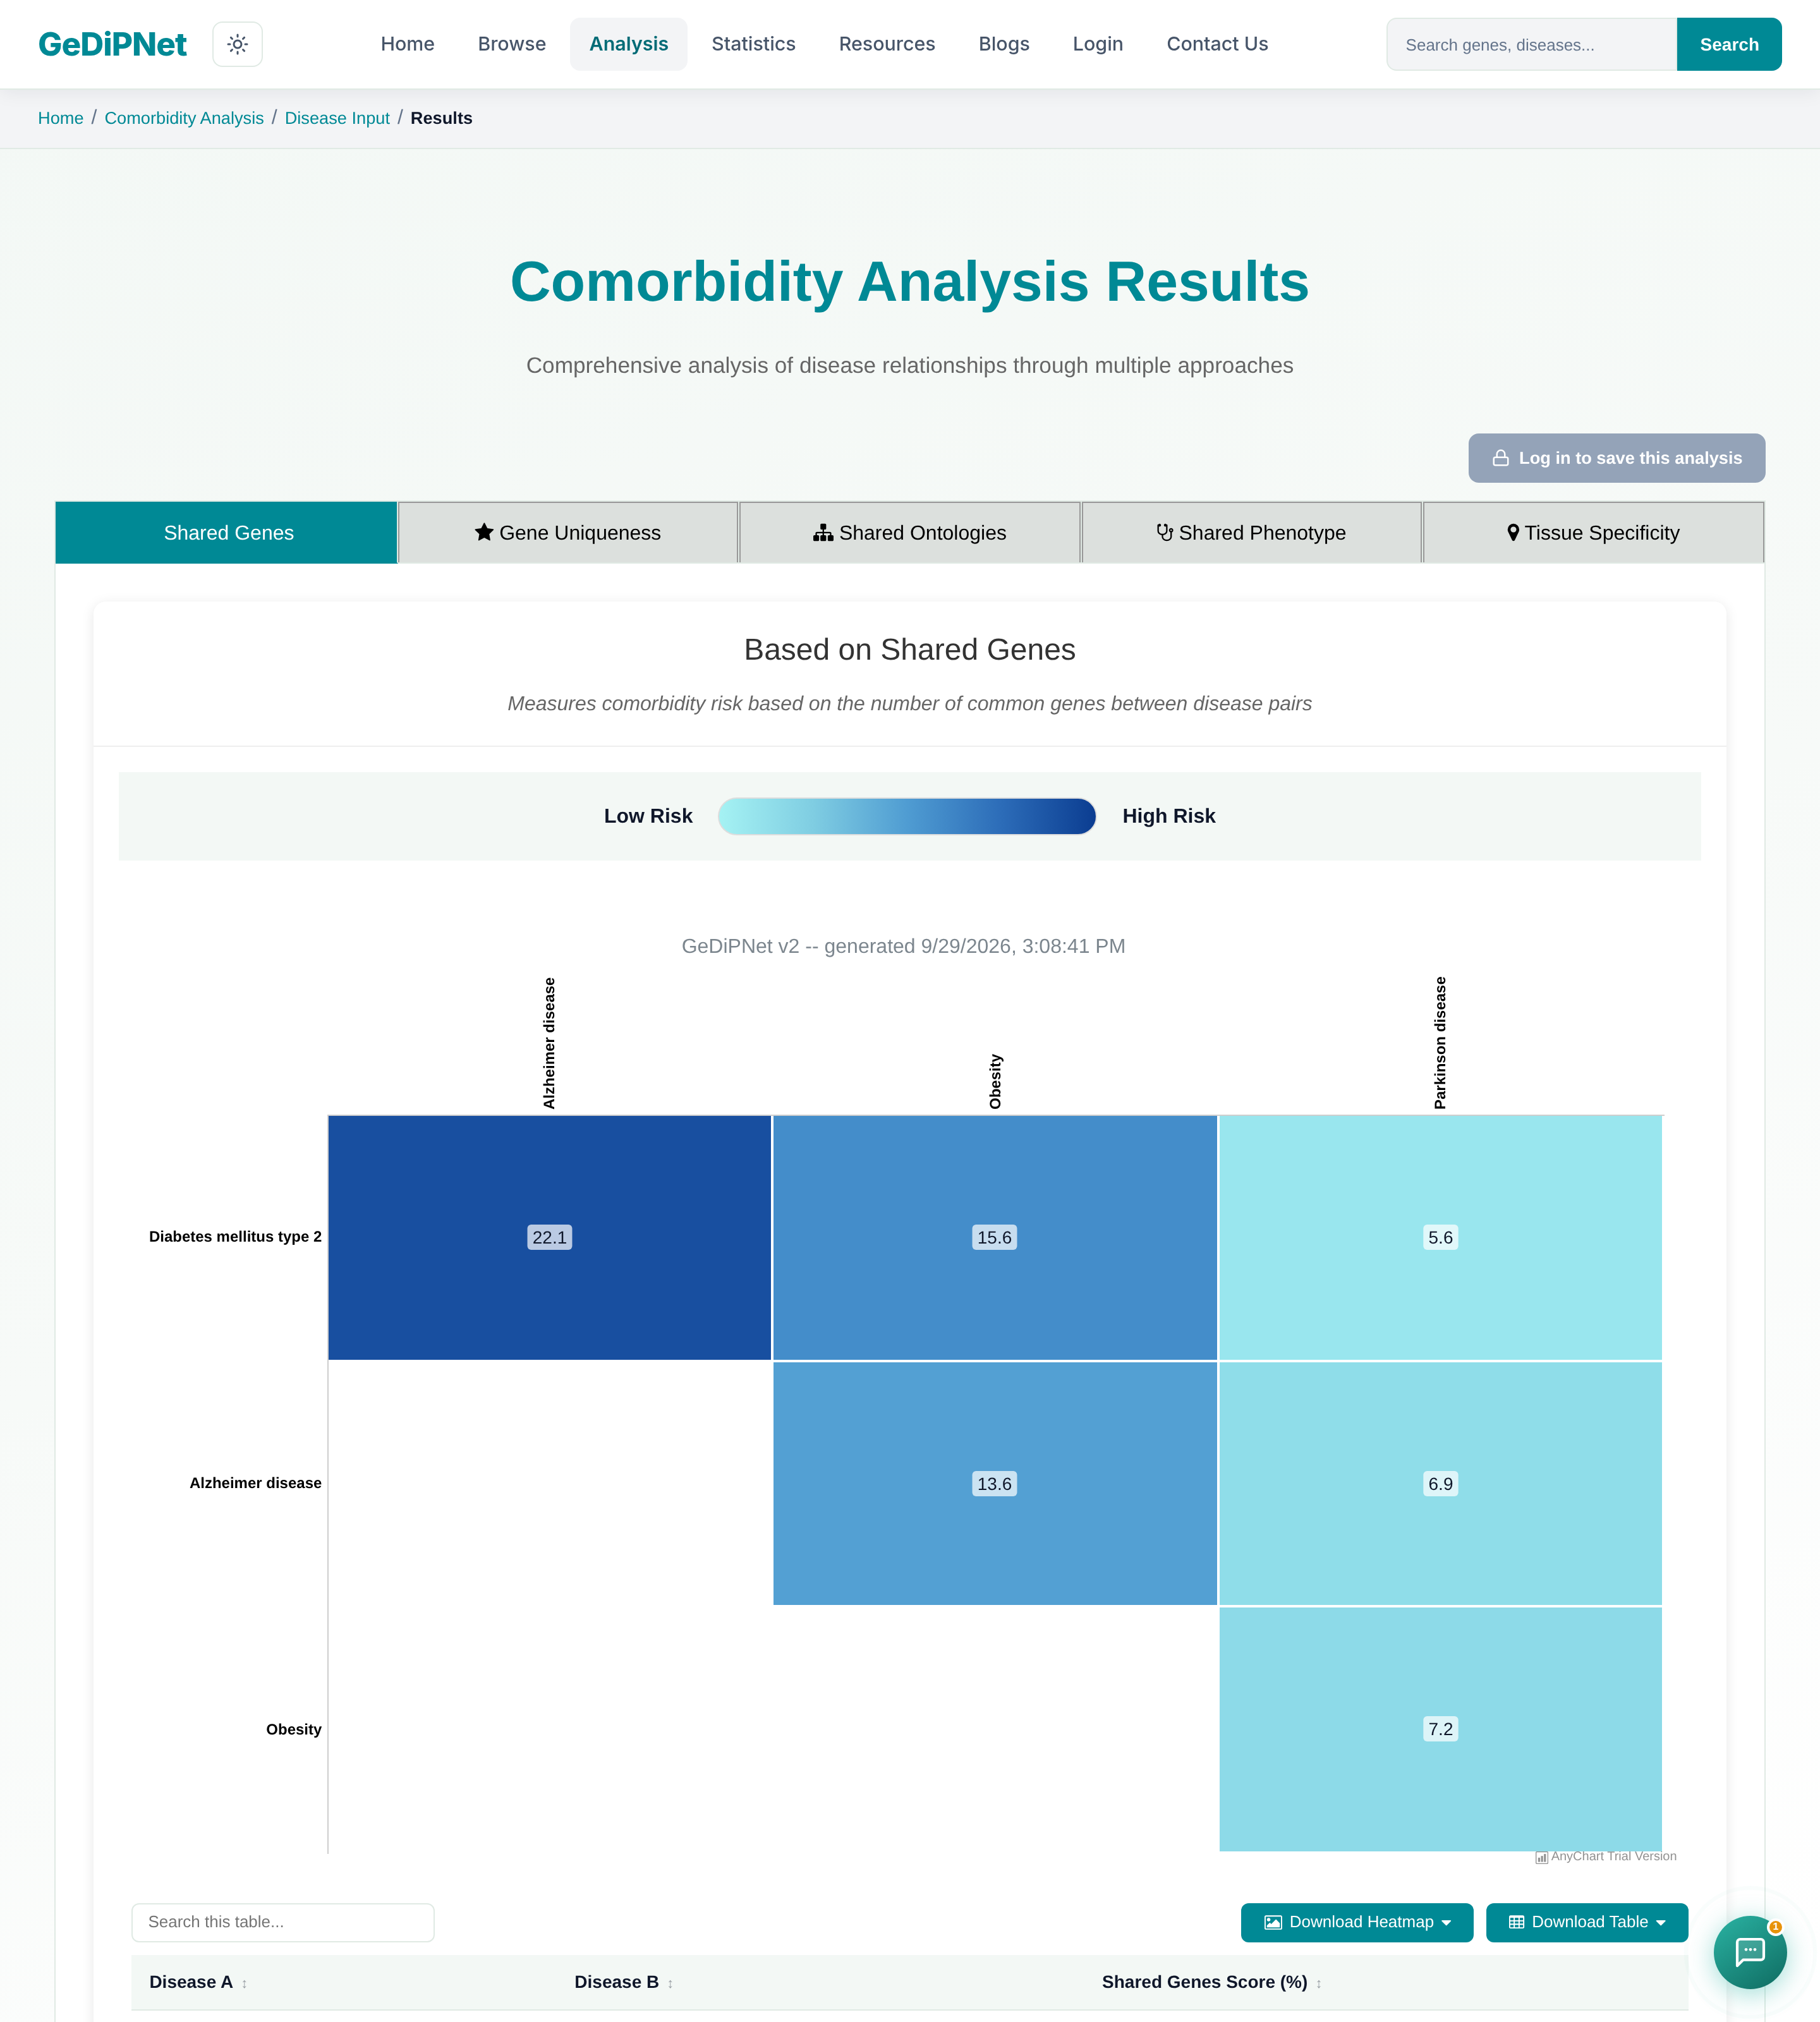
Results are scored across up to five tabs: Shared Genes (or Shared Diseases in Gene mode) measures overlap relative to whichever set is smaller; Gene/Disease Uniqueness weights that overlap by how distinctive the shared genes or diseases are; Shared Ontologies (Disease mode only) measures overlap in linked GO terms; Shared Phenotype measures overlap in the clinical signs and symptoms (HPO terms) each pair's genes are linked to; and Tissue Specificity measures overlap in the tissues where each pair's genes are actively expressed. With 3 or more diseases selected, every tab's heatmap grows to show every pairwise combination at once — not just one pair.
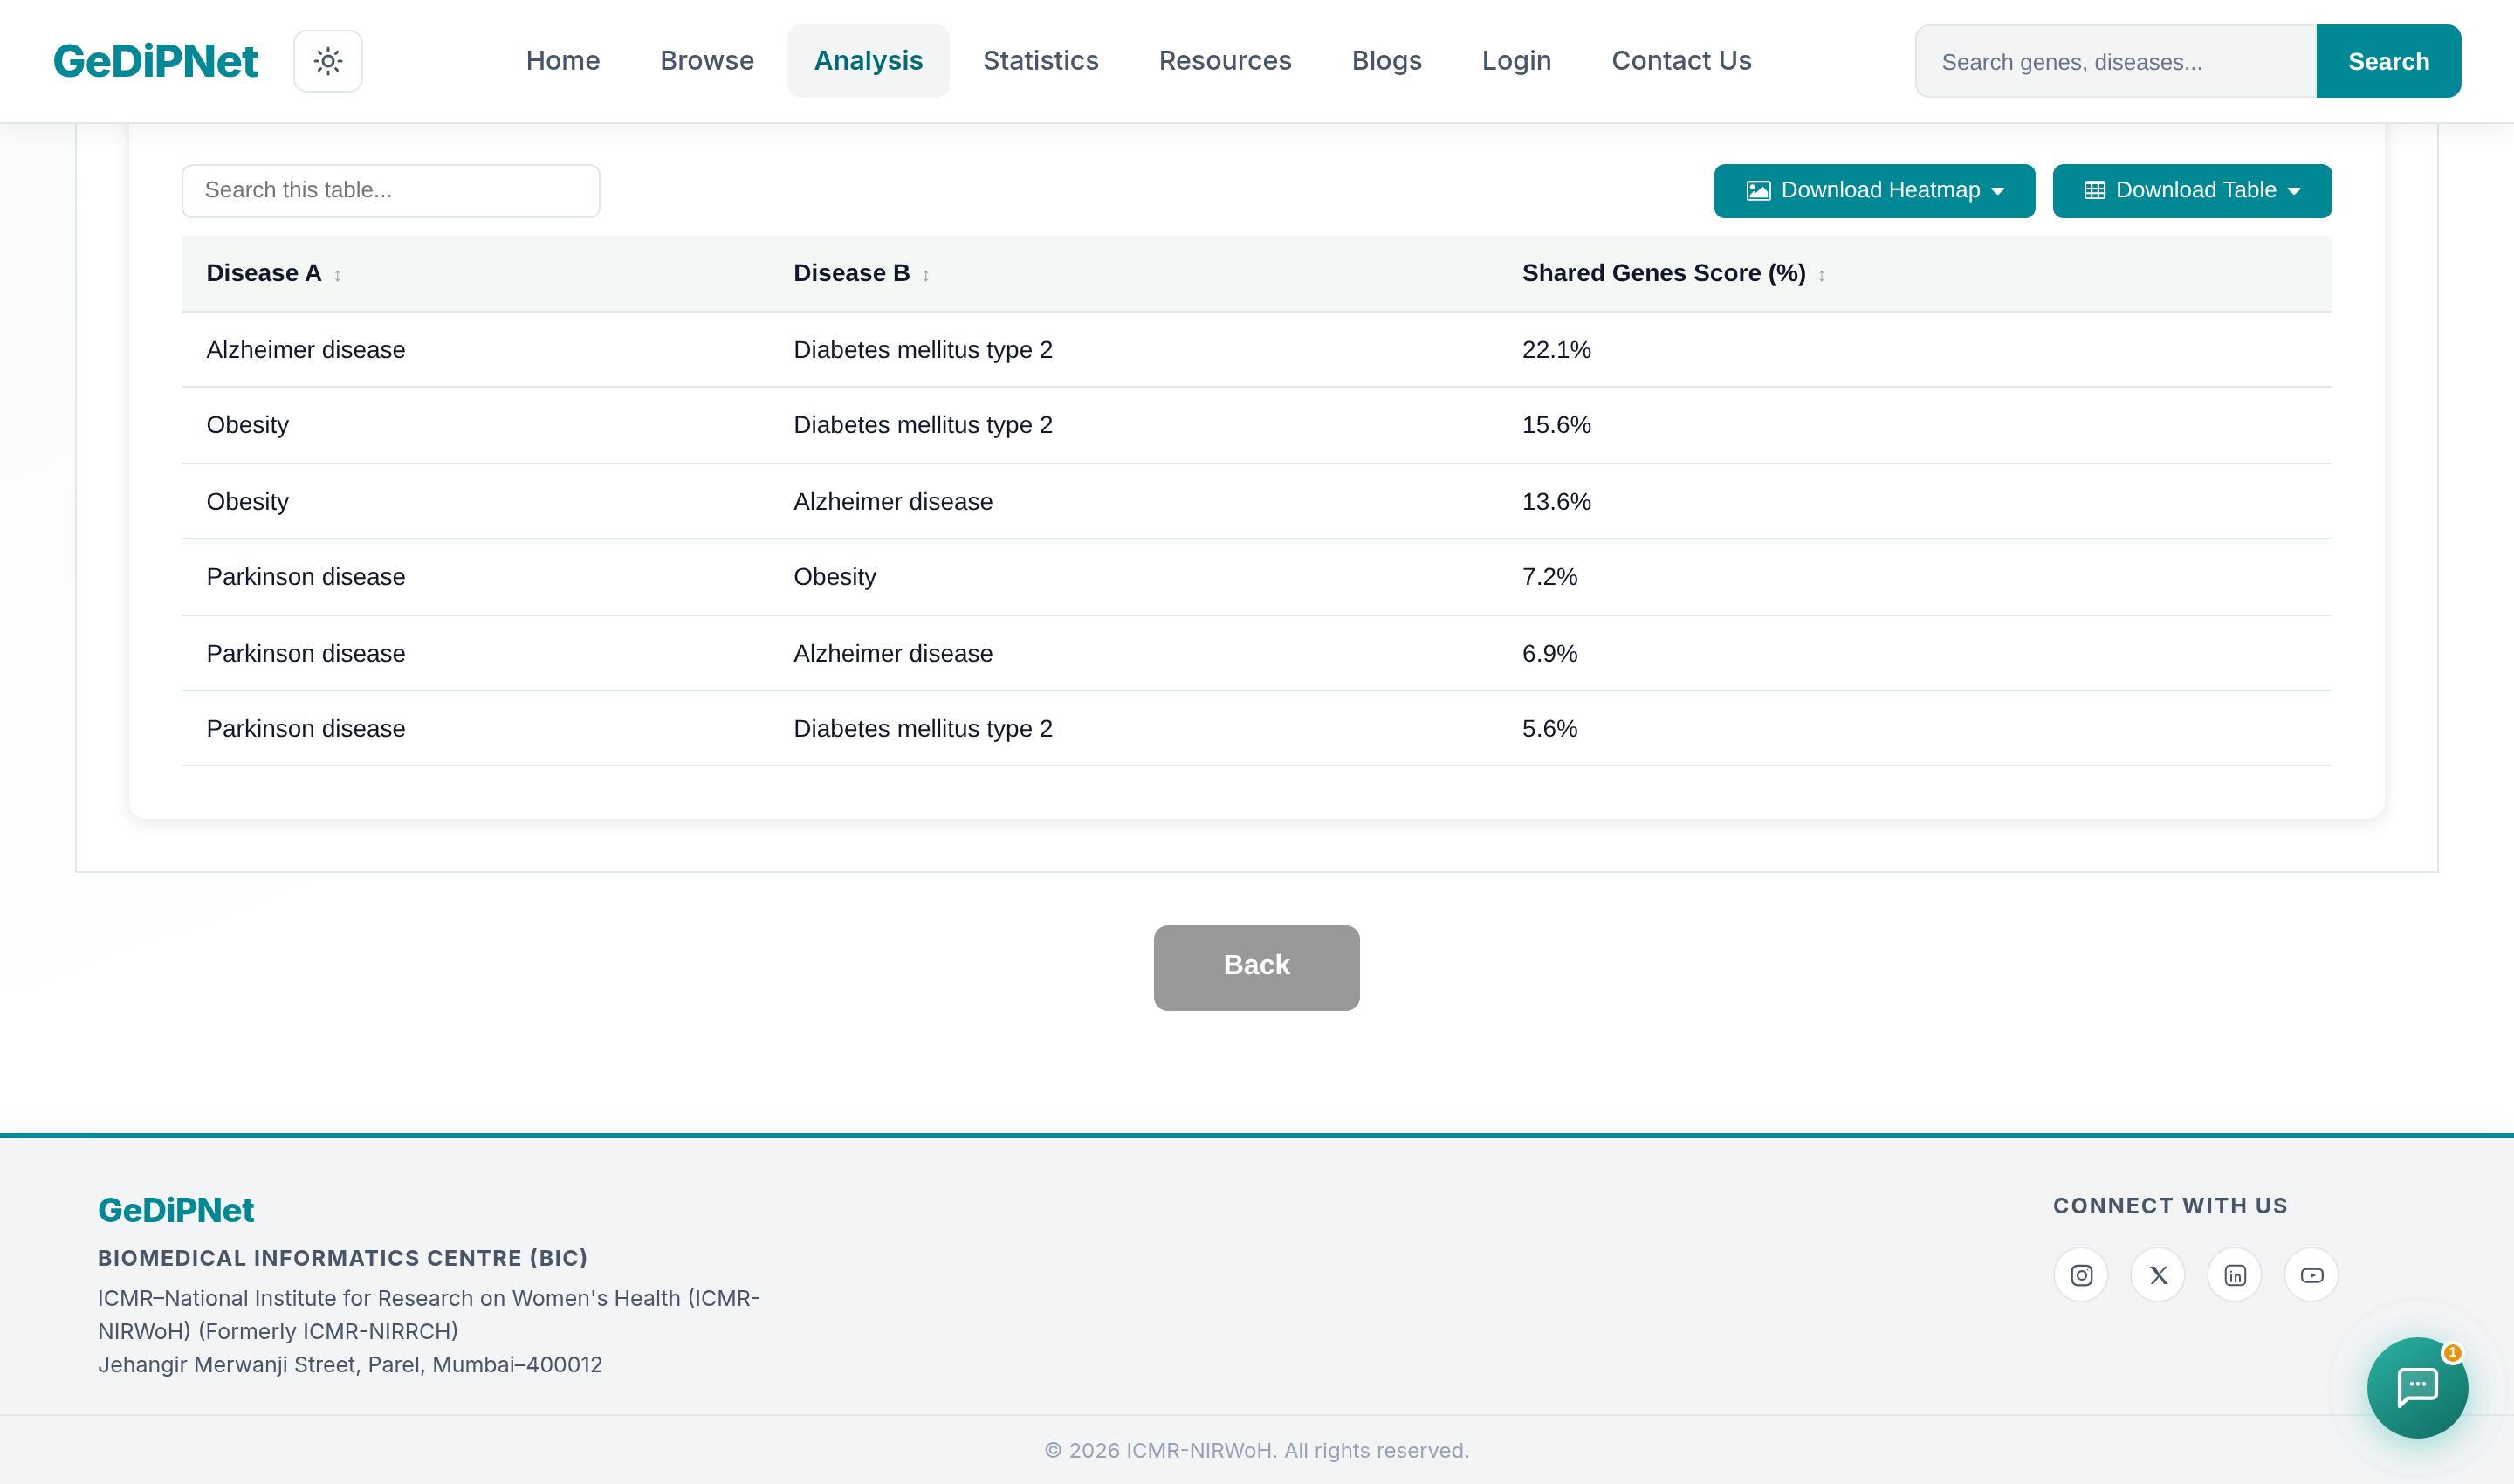
Below the heatmap sits the actual data table behind it — every pair listed as Disease A / Disease B / score, with its own search box and sortable columns, plus separate Download Heatmap (image) and Download Table (CSV/PDF) buttons. This is where you'd read off an exact number rather than eyeballing a color, or export just the numbers for a paper.