Help
Step-by-step user manual: search, browse genes & diseases, pathway analysis, enrichment, comorbidity, and more.
Enrichment Analysis
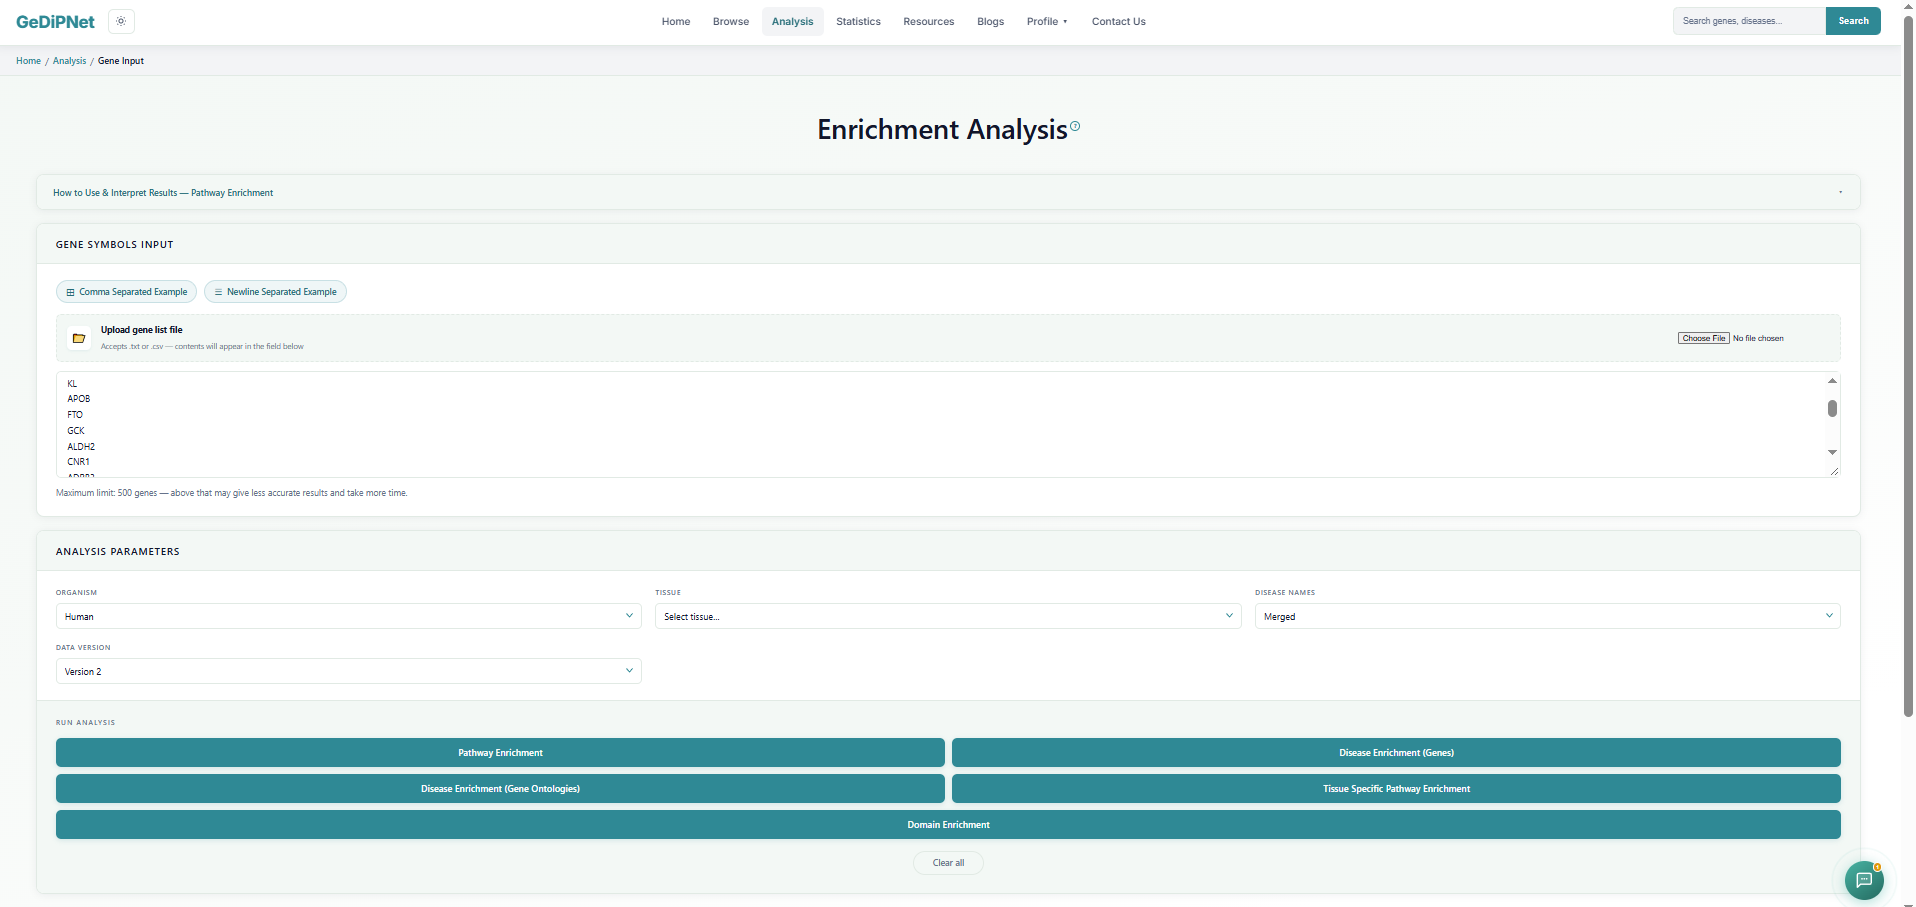
The Enrichment Analysis tool takes a gene list you provide and tests it against every disease or pathway in GeDiPNet, telling you which ones your list overlaps with more than chance would predict. Enter or upload a gene list (comma- or newline-separated), pick an organism (Human, Mouse, Rat, or Zebrafish), and choose one of five modes: Pathway enrichment, Disease enrichment (genes), Disease enrichment (gene ontologies), Domain enrichment (Pfam protein domains), or Tissue-specific pathway enrichment (which also needs a tissue of interest).
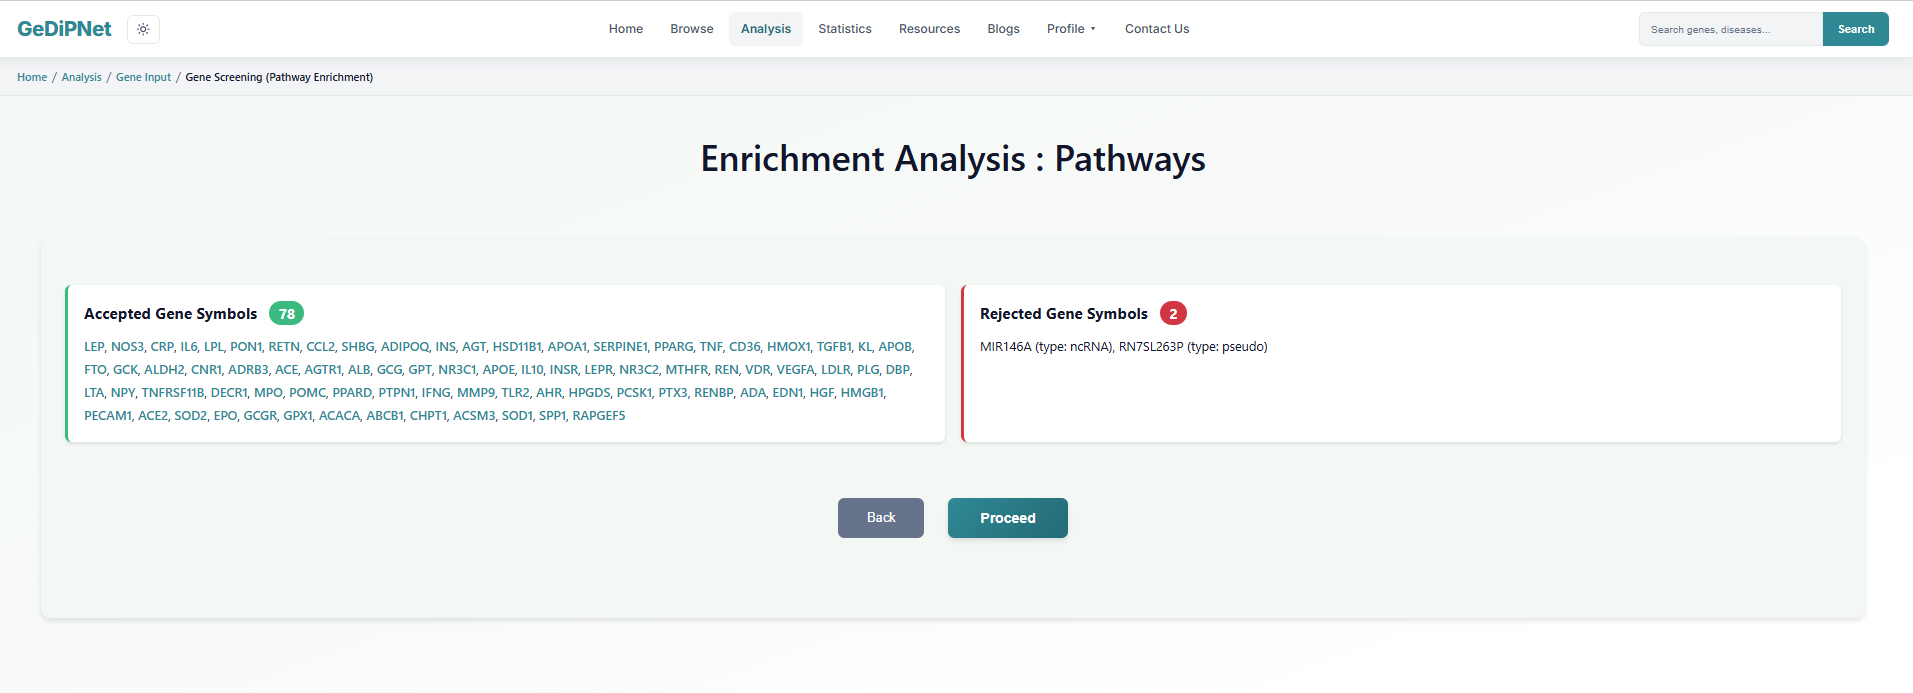
Submitting the form screens every gene symbol you entered and shows which were recognized (Accepted Gene Symbols) and which weren't (Rejected Gene Symbols), so a typo doesn't silently drop a gene from the run. From here you can go Back to edit the list or Proceed to the actual analysis.
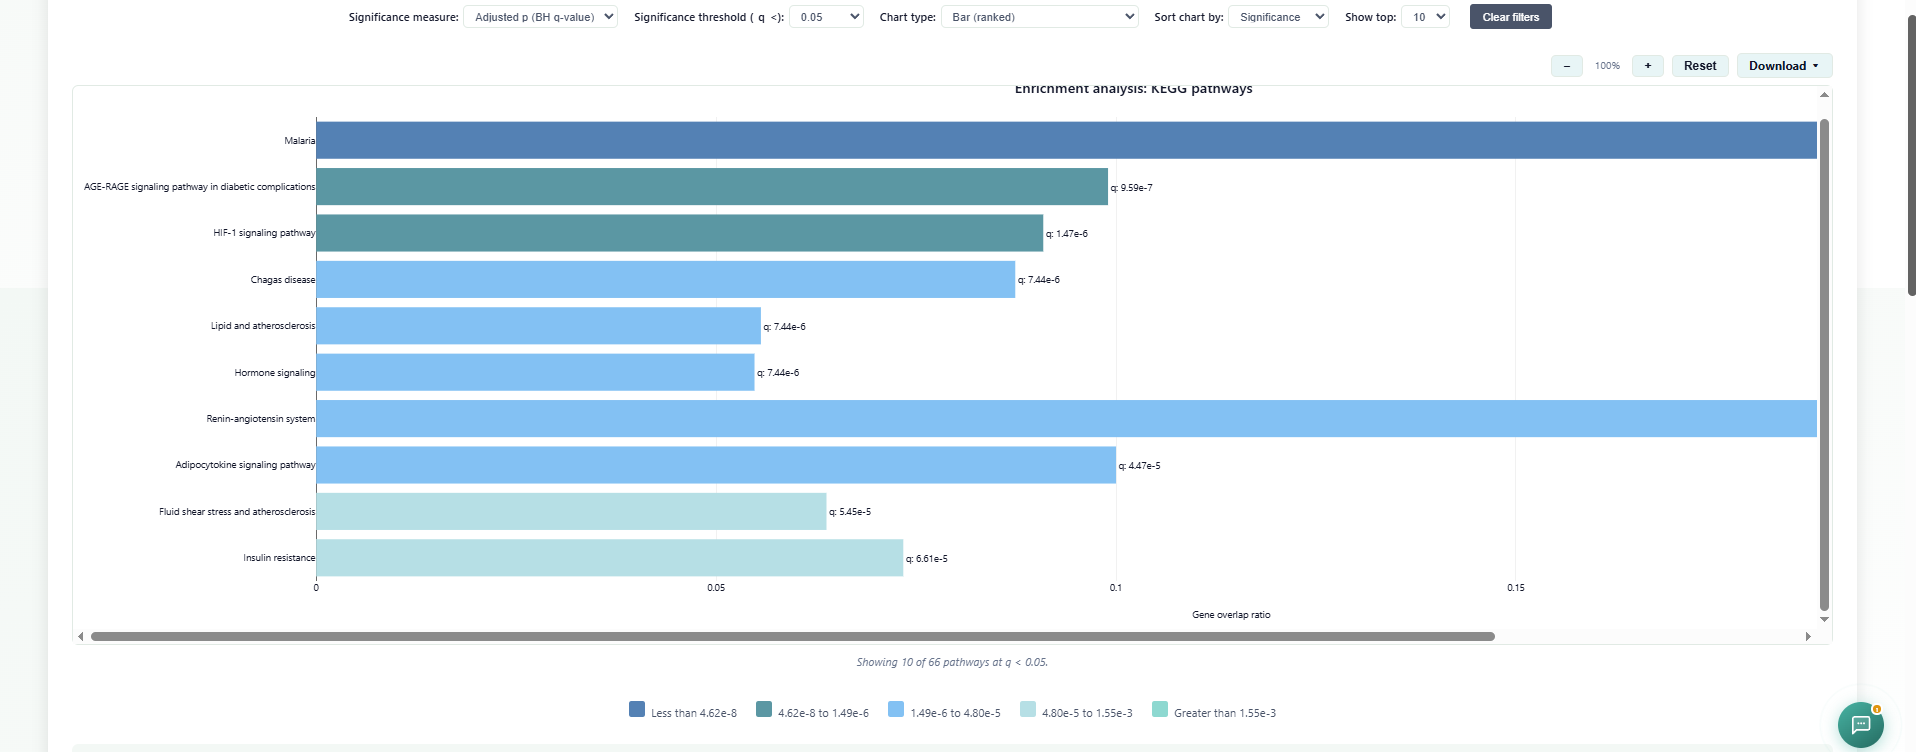
The results page opens with the chart first: a horizontal bar chart of every significantly enriched KEGG pathway — by default those with an adjusted p-value (q-value) below 0.05 — ranked by gene overlap ratio and color-coded by significance band. Controls above it let you choose the significance measure (adjusted q-value by default, or the raw p-value), change the significance threshold, switch to a bubble chart, sort by significance, overlap ratio or gene count, limit how many pathways are shown, and zoom/pan; a legend at the bottom explains the color bands, and a Download button exports the chart as PNG/JPEG.
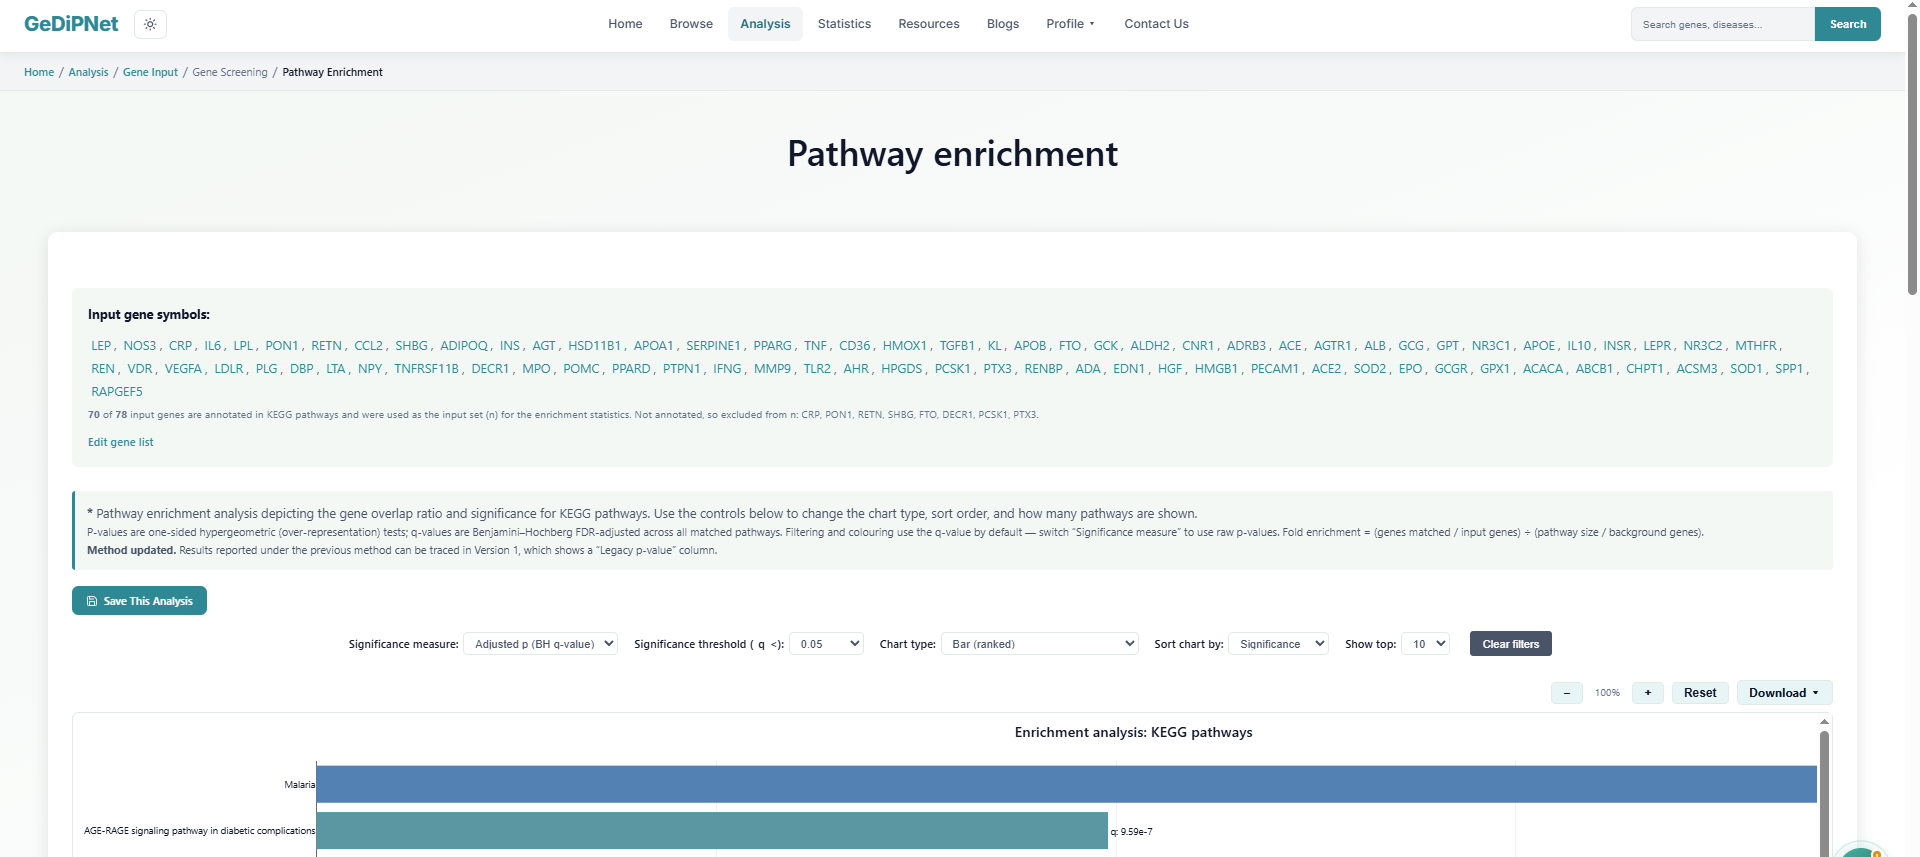
Below the chart is the full results table — every matched pathway with its overlapping genes (linked to their gene detail pages), genes-matched fraction, overlap ratio, hypergeometric p-value, fold enrichment, adjusted p-value (q-value) and, in Version 1 on most modes, a greyed-out legacy p-value (see below). It's sortable and searchable, has a min-genes-matched filter, a "select top N by significance" shortcut with row highlighting, and its own CSV/PDF export separate from the chart image. An "Edit gene list" box lets you tweak and resubmit the input without starting over, and a Gene network analysis button carries your matched genes straight into a network view. Logged-in users also get a "Save This Analysis" button.
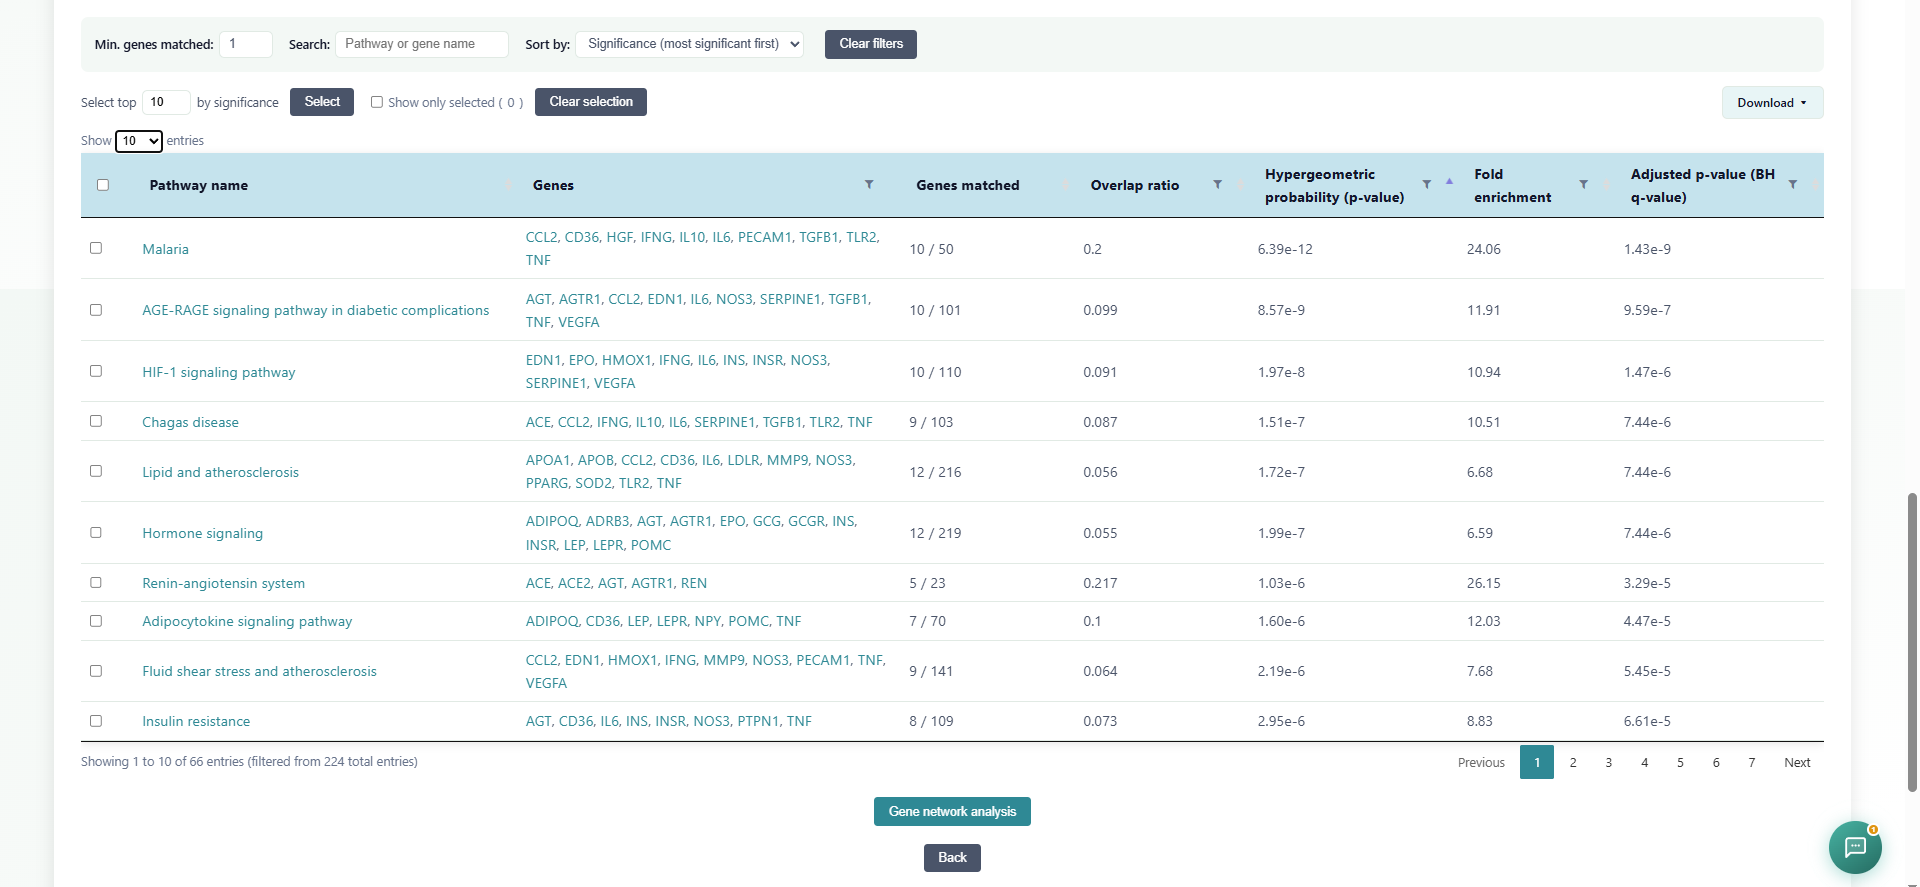
How to read the statistics. Every mode uses the same columns:
- P-value — the chance of seeing at least this much overlap between your list and the pathway (or disease, domain) purely by chance, from a one-sided hypergeometric test. Only your input genes that appear in that mode's annotation data count towards the test; the line under your gene list shows how many did (e.g. "10 of 11 input genes are annotated…").
- Adjusted p-value (q-value) — the p-value corrected for testing many pathways at once (Benjamini–Hochberg false discovery rate). If you keep every result with q < 0.05, about 5% of them are expected to be false positives. This is what the threshold, chart colours and "select top N" use by default; switch Significance measure to Raw p-value to filter on p instead.
- Fold enrichment — how many times more often the pathway's genes appear in your list than expected by chance: (genes matched ÷ your input genes) ÷ (pathway size ÷ all background genes). 1 means no enrichment. Read it alongside the q-value — a large fold from only one or two genes can still be weak evidence.
- Legacy p-value (deprecated) — the value these pages reported under their previous method (the probability of exactly the observed overlap), reproduced only so earlier or published results can be traced. Don't use it to judge significance. It appears in Version 1 only (whose data is frozen, so the old values can be recreated exactly), on the pathway, disease (genes), domain and tissue-specific modes; results from the previous method can't be reproduced for disease enrichment (gene ontologies). See Dataset Versions for details of the method update.
Two modes work slightly differently. Tissue-specific pathway enrichment compares your genes against the KEGG genes expressed in the chosen tissue at or above the selected nTPM cutoff, so changing the cutoff recomputes every value. Disease enrichment (gene ontologies) compares the GO Biological Process terms of your genes with each disease's terms (human annotations only); because GO terms are nested and correlated, treat its p- and q-values as a similarity score for ranking diseases rather than a strict significance level. Definitions of every column are also in the Glossary.