Help
Introduction
GeDiPNeT is a comprehensive database on all human gene disease pathway networks. The database integrates gene-disease relationships from major authoritative sources including DisGeNET, ClinGen, ClinVar, GenCC, GWAS Catalog, CBGDA (CRISPR-Based Gene-Disease Associations), the Human Phenotype Ontology (HPO), OrphaNet, PsyGeNET, and textmining. Information in the database is compiled and maintained through manual curation to ensure standardized disease terminology and reduce redundancy. GeDiPNet defines gene-disease associations based on both literature-curated evidence and text-mining approaches. The database provides comprehensive information on genes, single nucleotide polymorphisms (SNPs), diseases, and biological pathways, with detailed annotations including gene synonyms, chromosomal locations, expression profiles, and protein-related data.
GeDiPNeT is an open source resource that is developed and maintained by the Biomedical Informatics centre at the ICMR - National Institute for Research in Reproductive and Child Health (NIRRCH), located at Mumbai, India.
1. Homepage
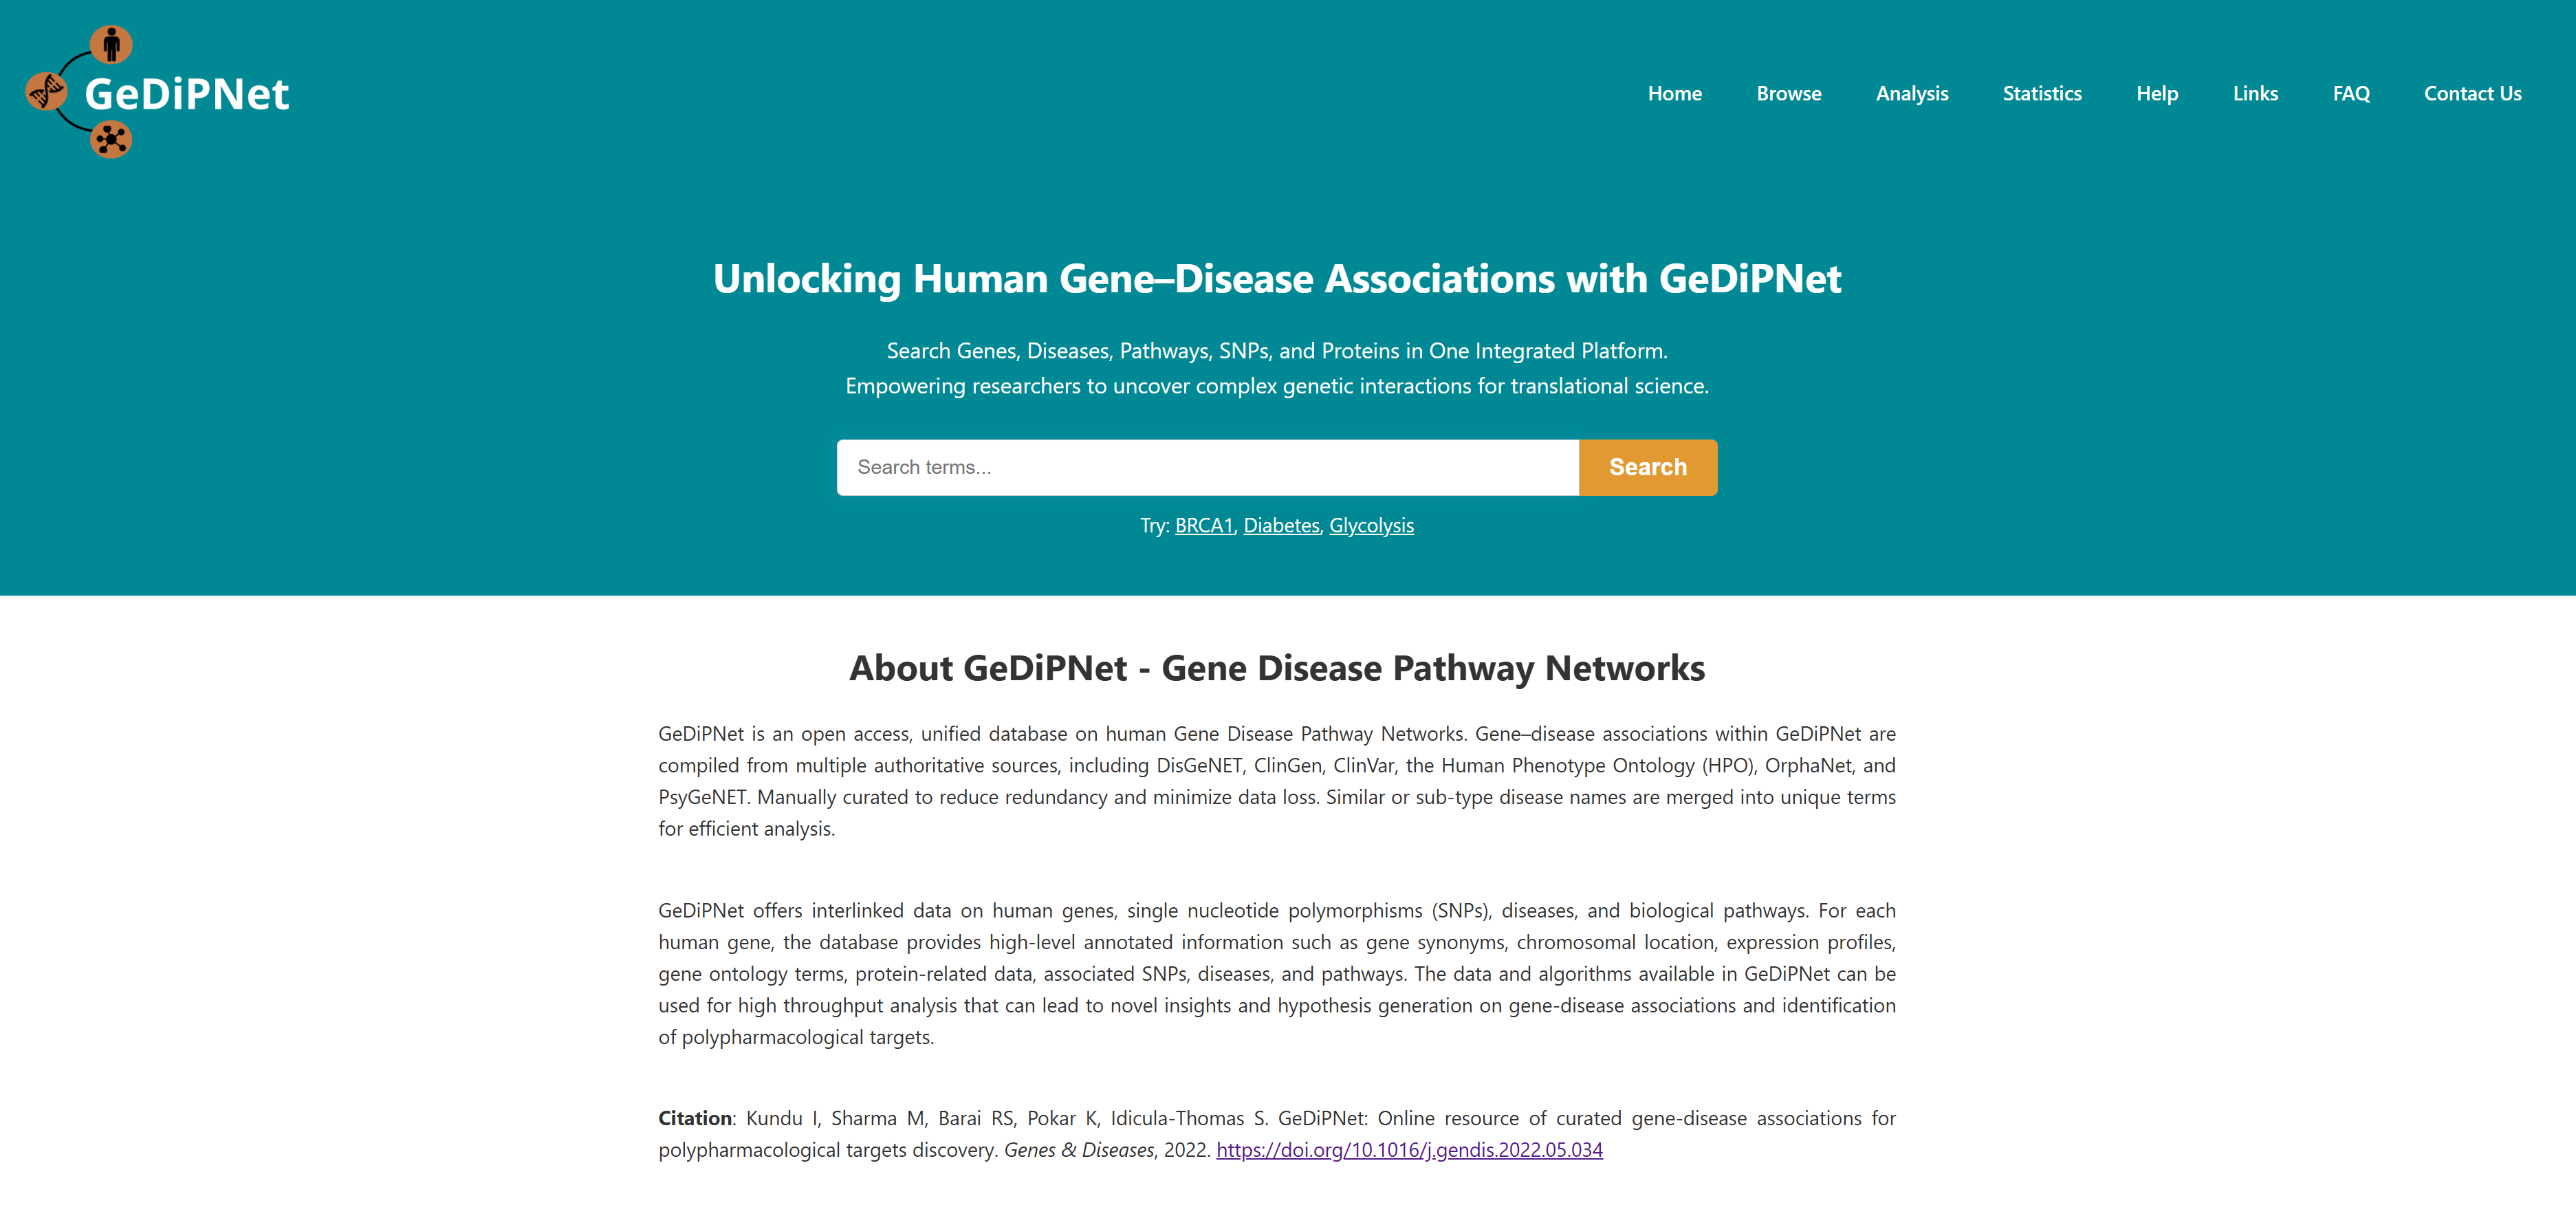
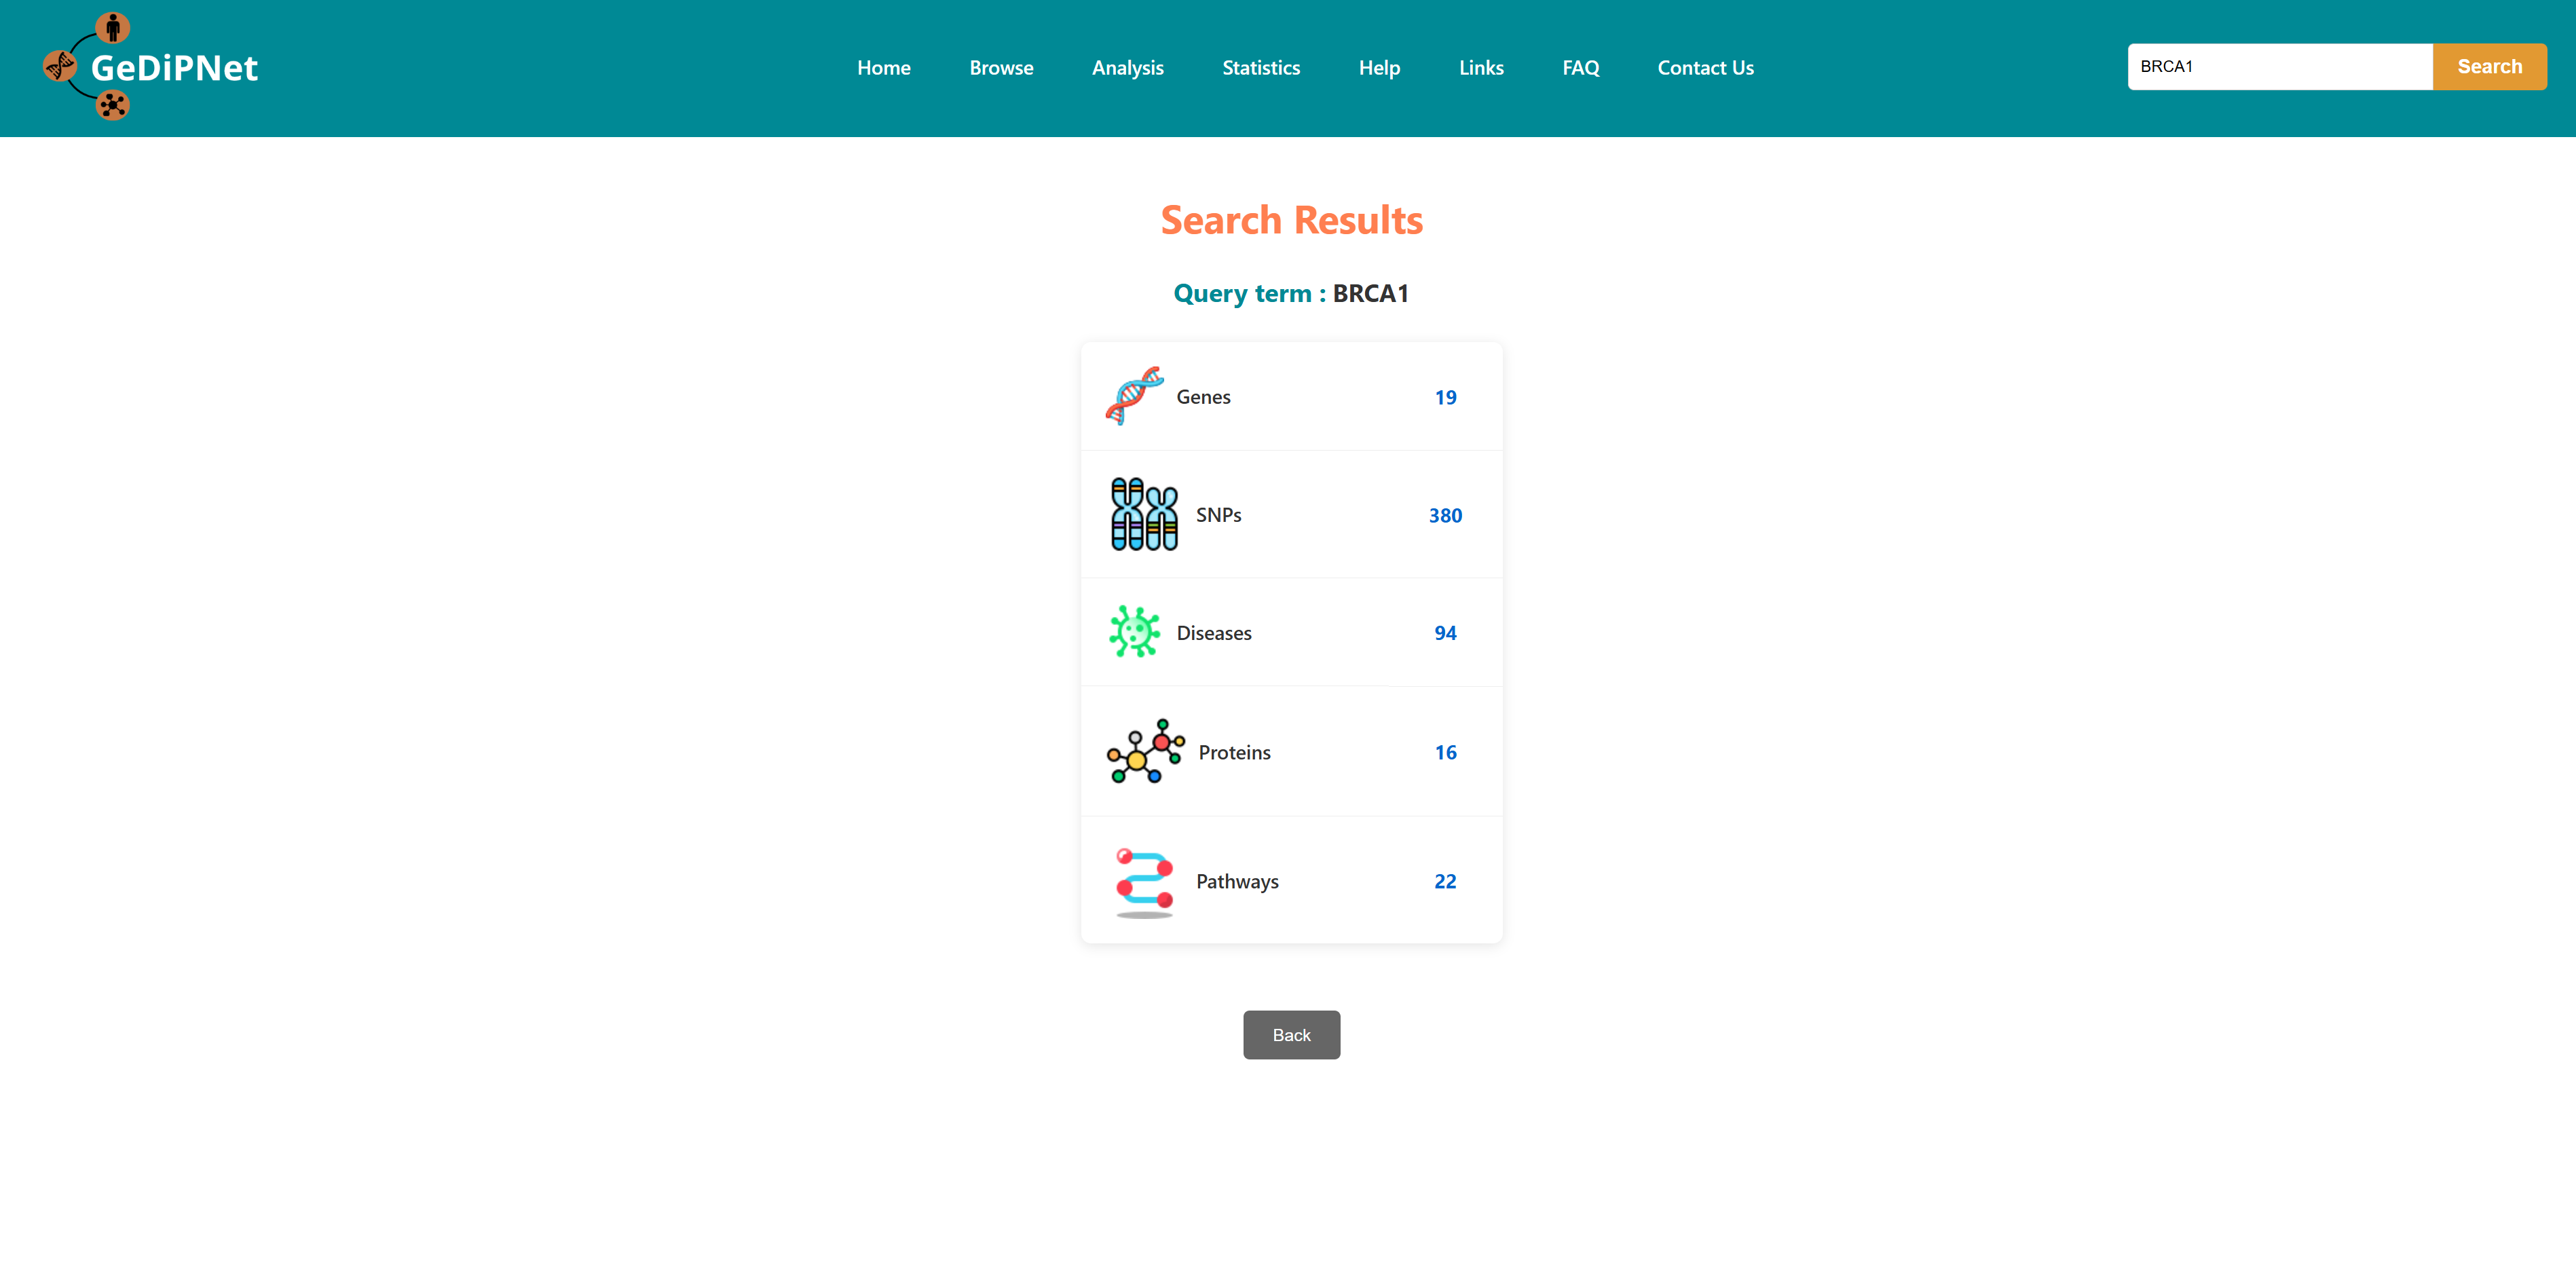
The GeDiPNet homepage presents a concise overview of the database architecture and computational methodologies. Data can be retrieved using the navigation tabs on the top left of the webpage. It features a simple text search tool located at the centre of the homepage. To search type a biological identifiers including gene names, disease names, SNPs, pathway identifiers, or any keyword. Search results displays a categorized summary of all database entries related to the query term. Click on any of the results to go to a page of information about it.

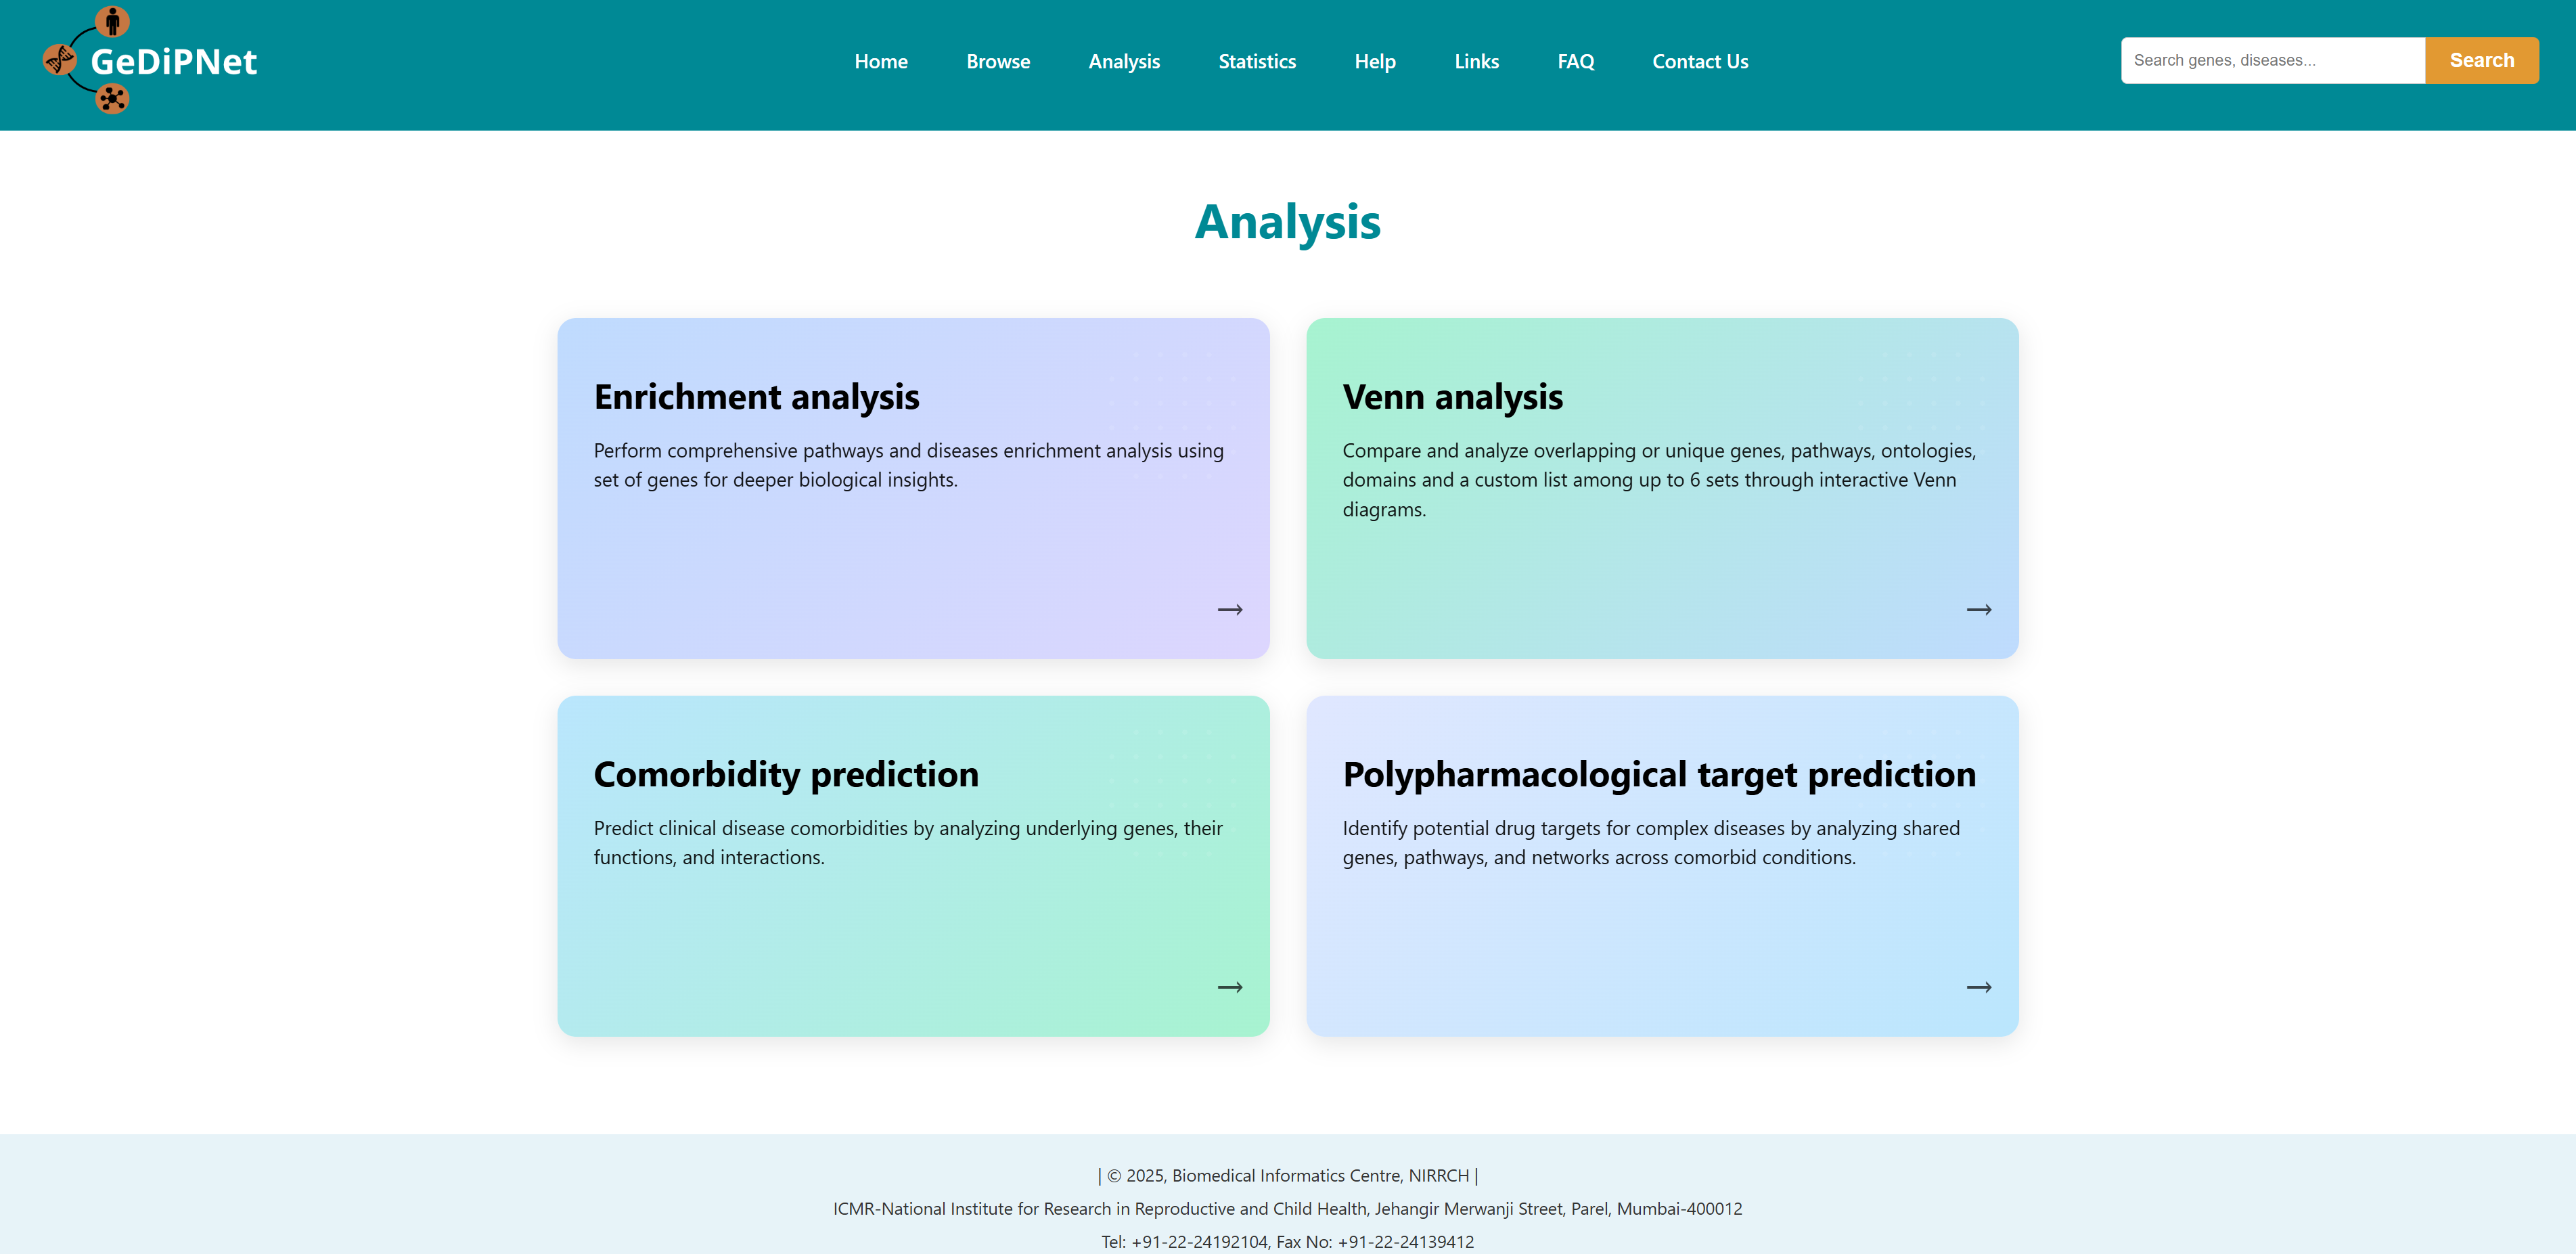
GeDiPNet provides four specialized analysis tools accessible through the "I Want to Identify..." section on the homepage. These interactive tabs are designed to address specific research questions in gene-disease-pathway analysis:
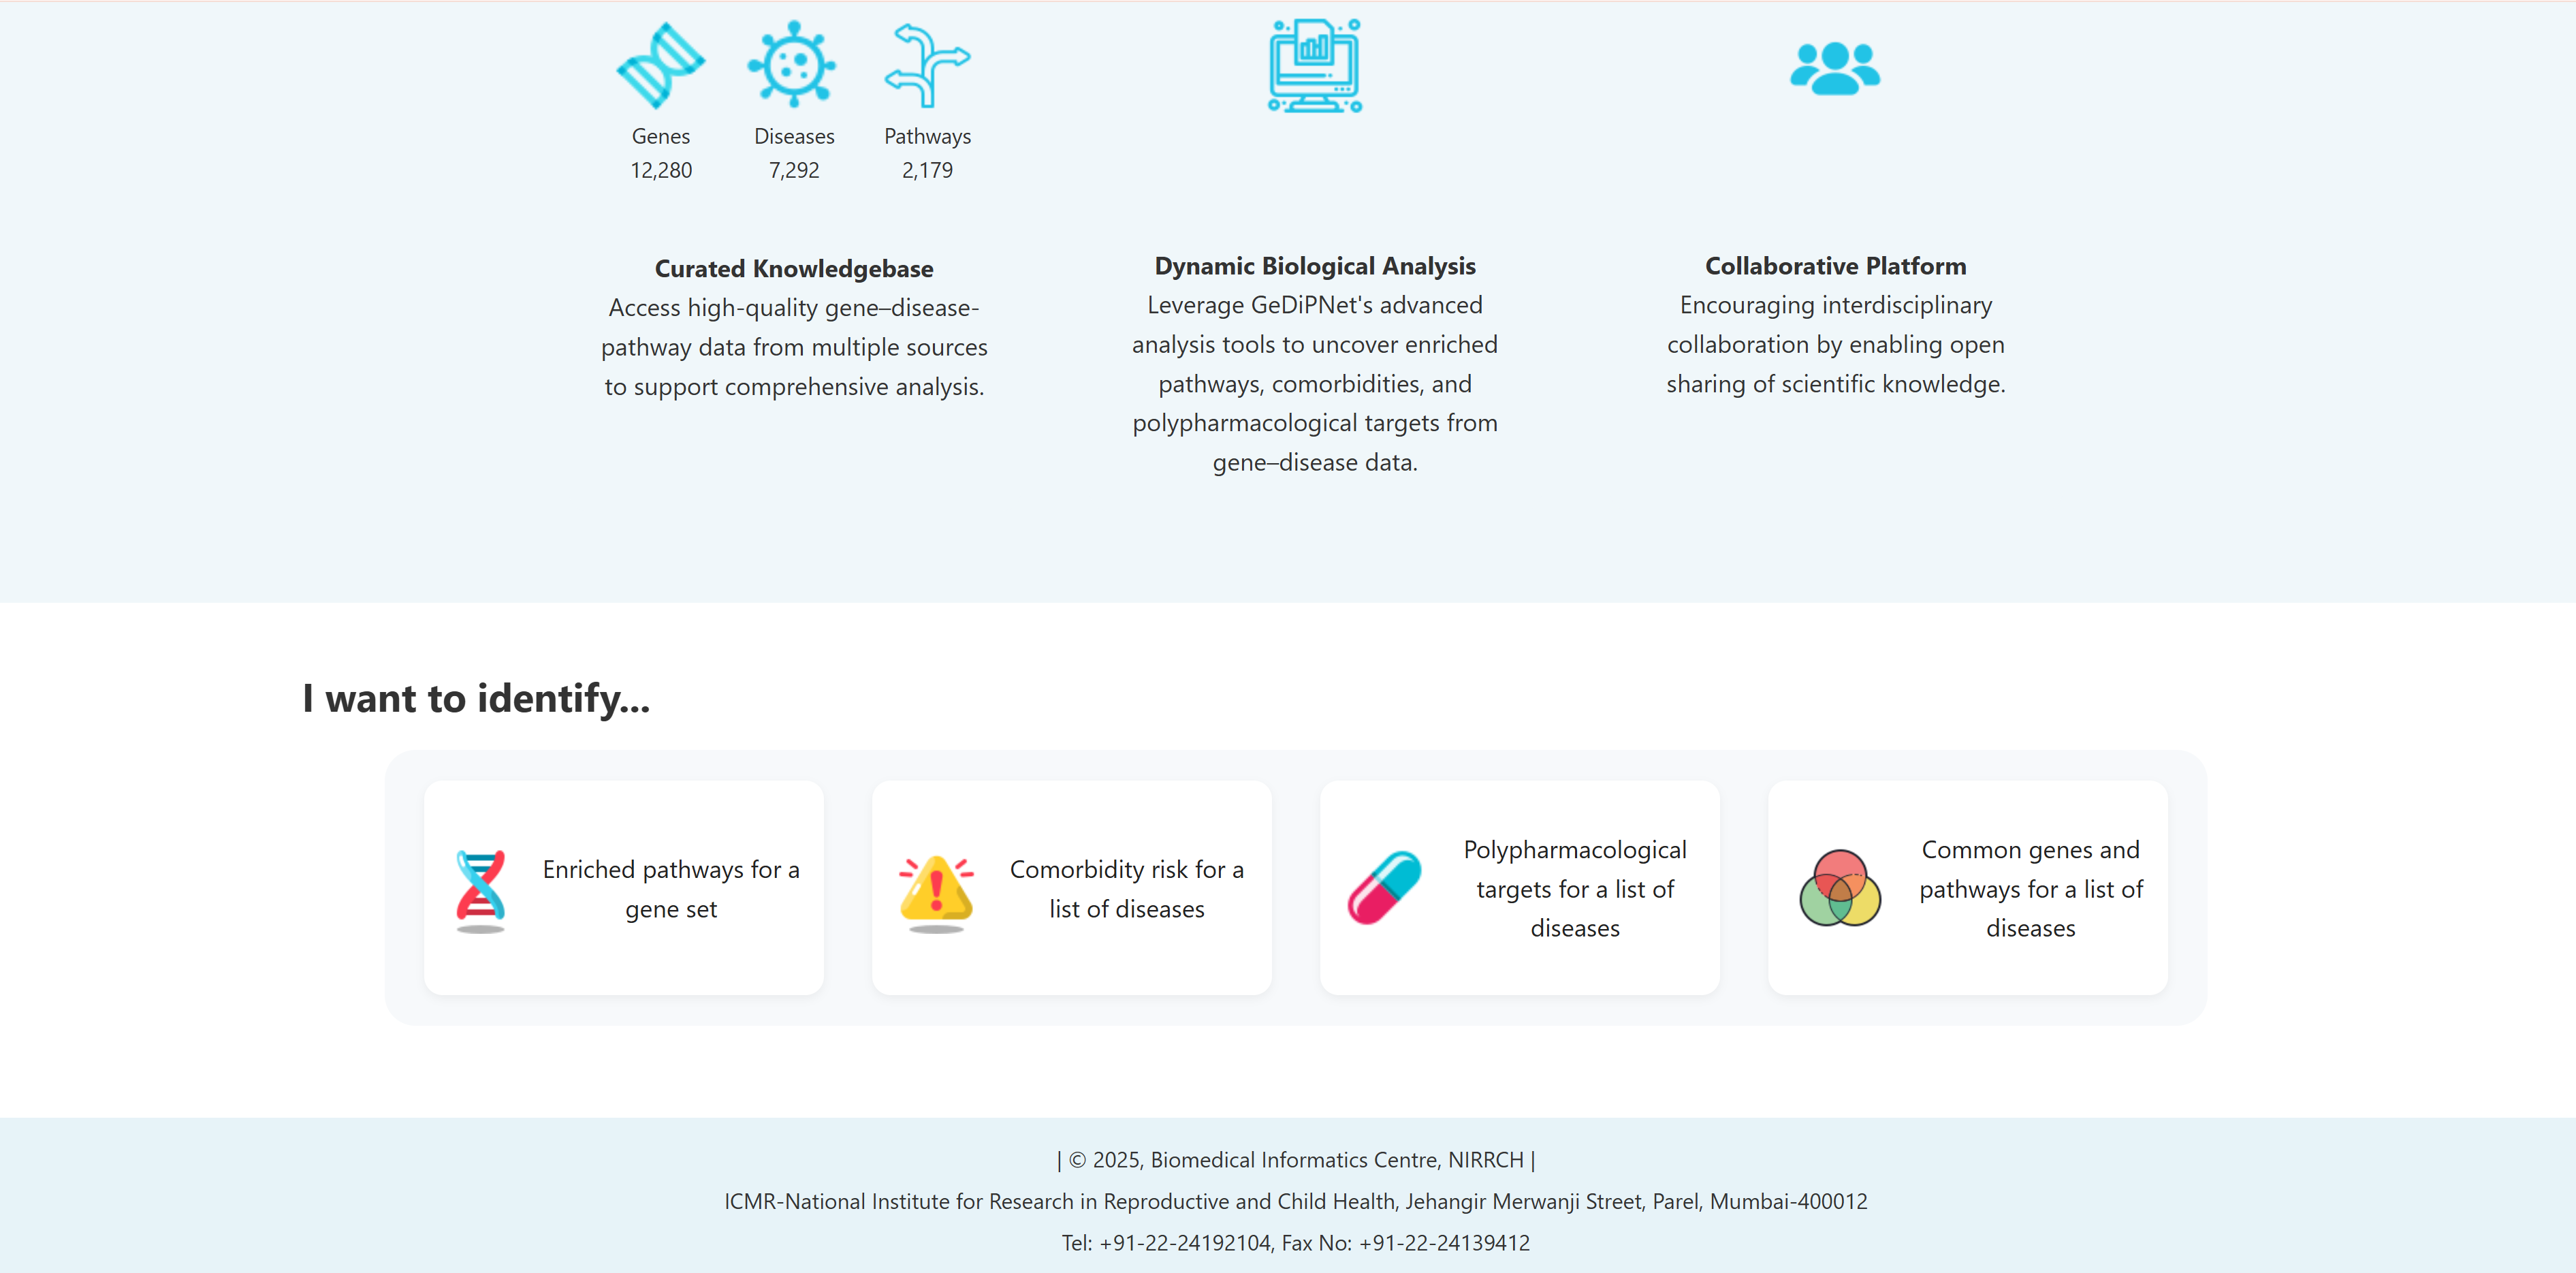
- I want to identify enriched pathways for a gene set: To perform comprehensive pathway, diseases and tissue specific pathway enrichment analysis using set of genes for deeper biological insights.
- I want to identify comorbidity risk for a list of diseases: To identify potential disease co-occurrences by analyzing shared genes between multiple diseases.
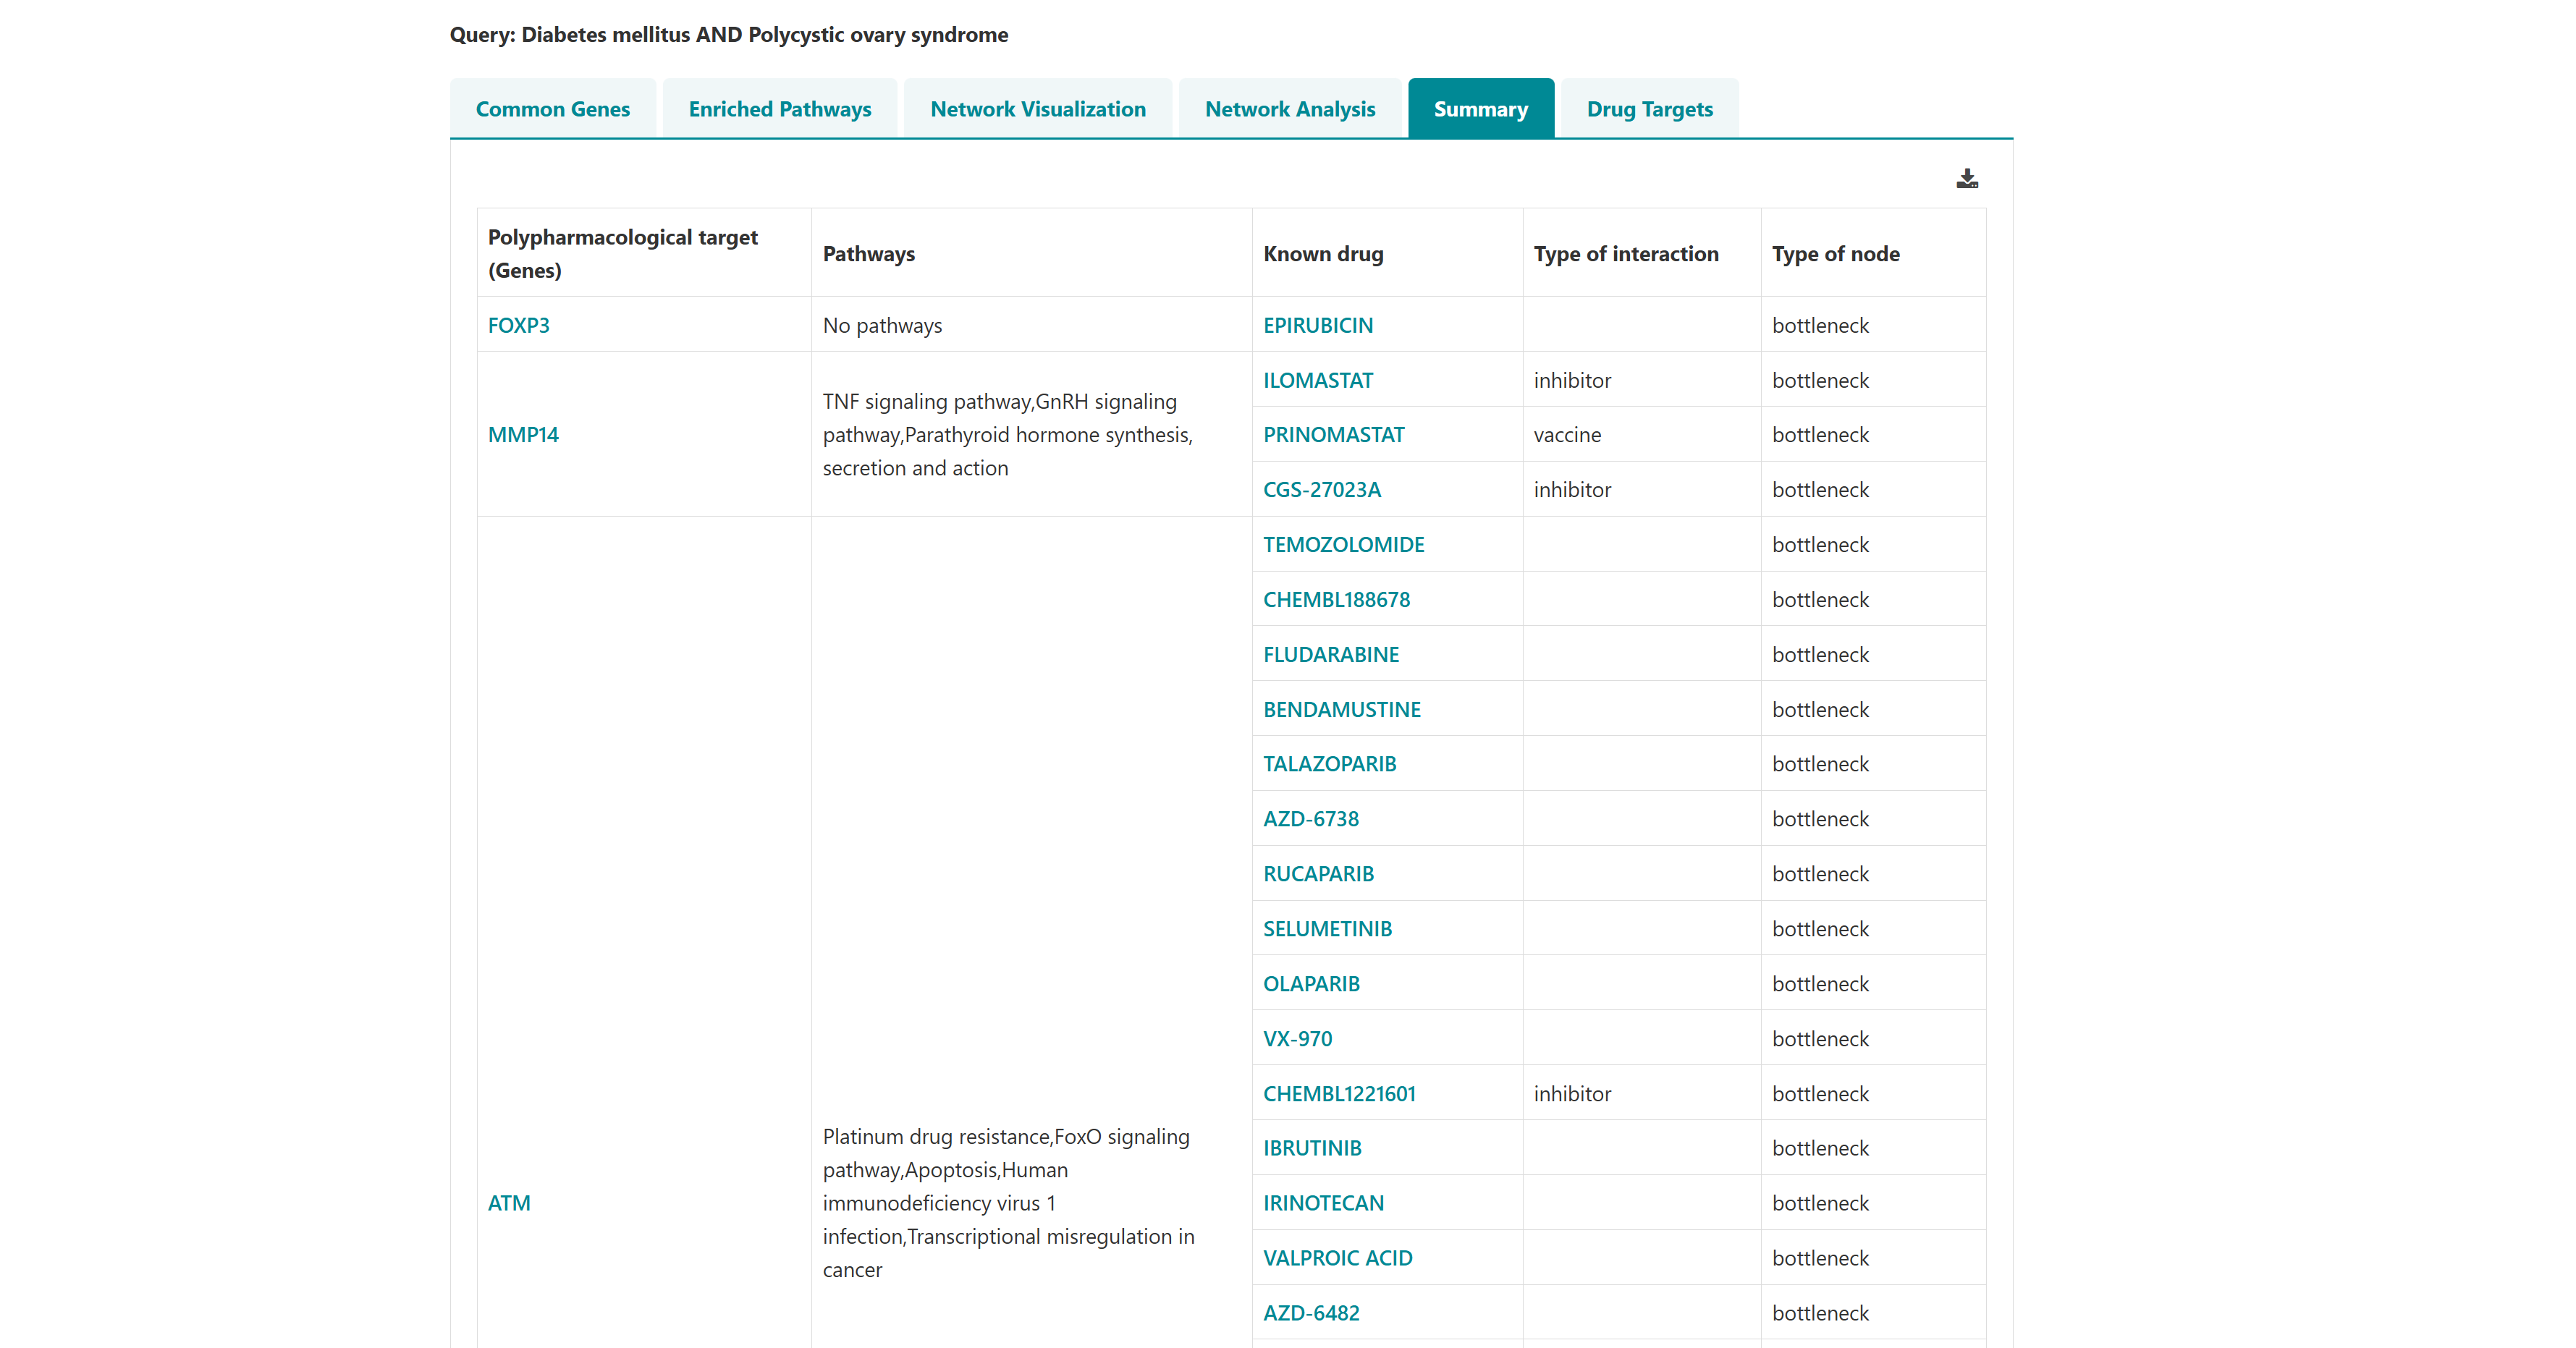
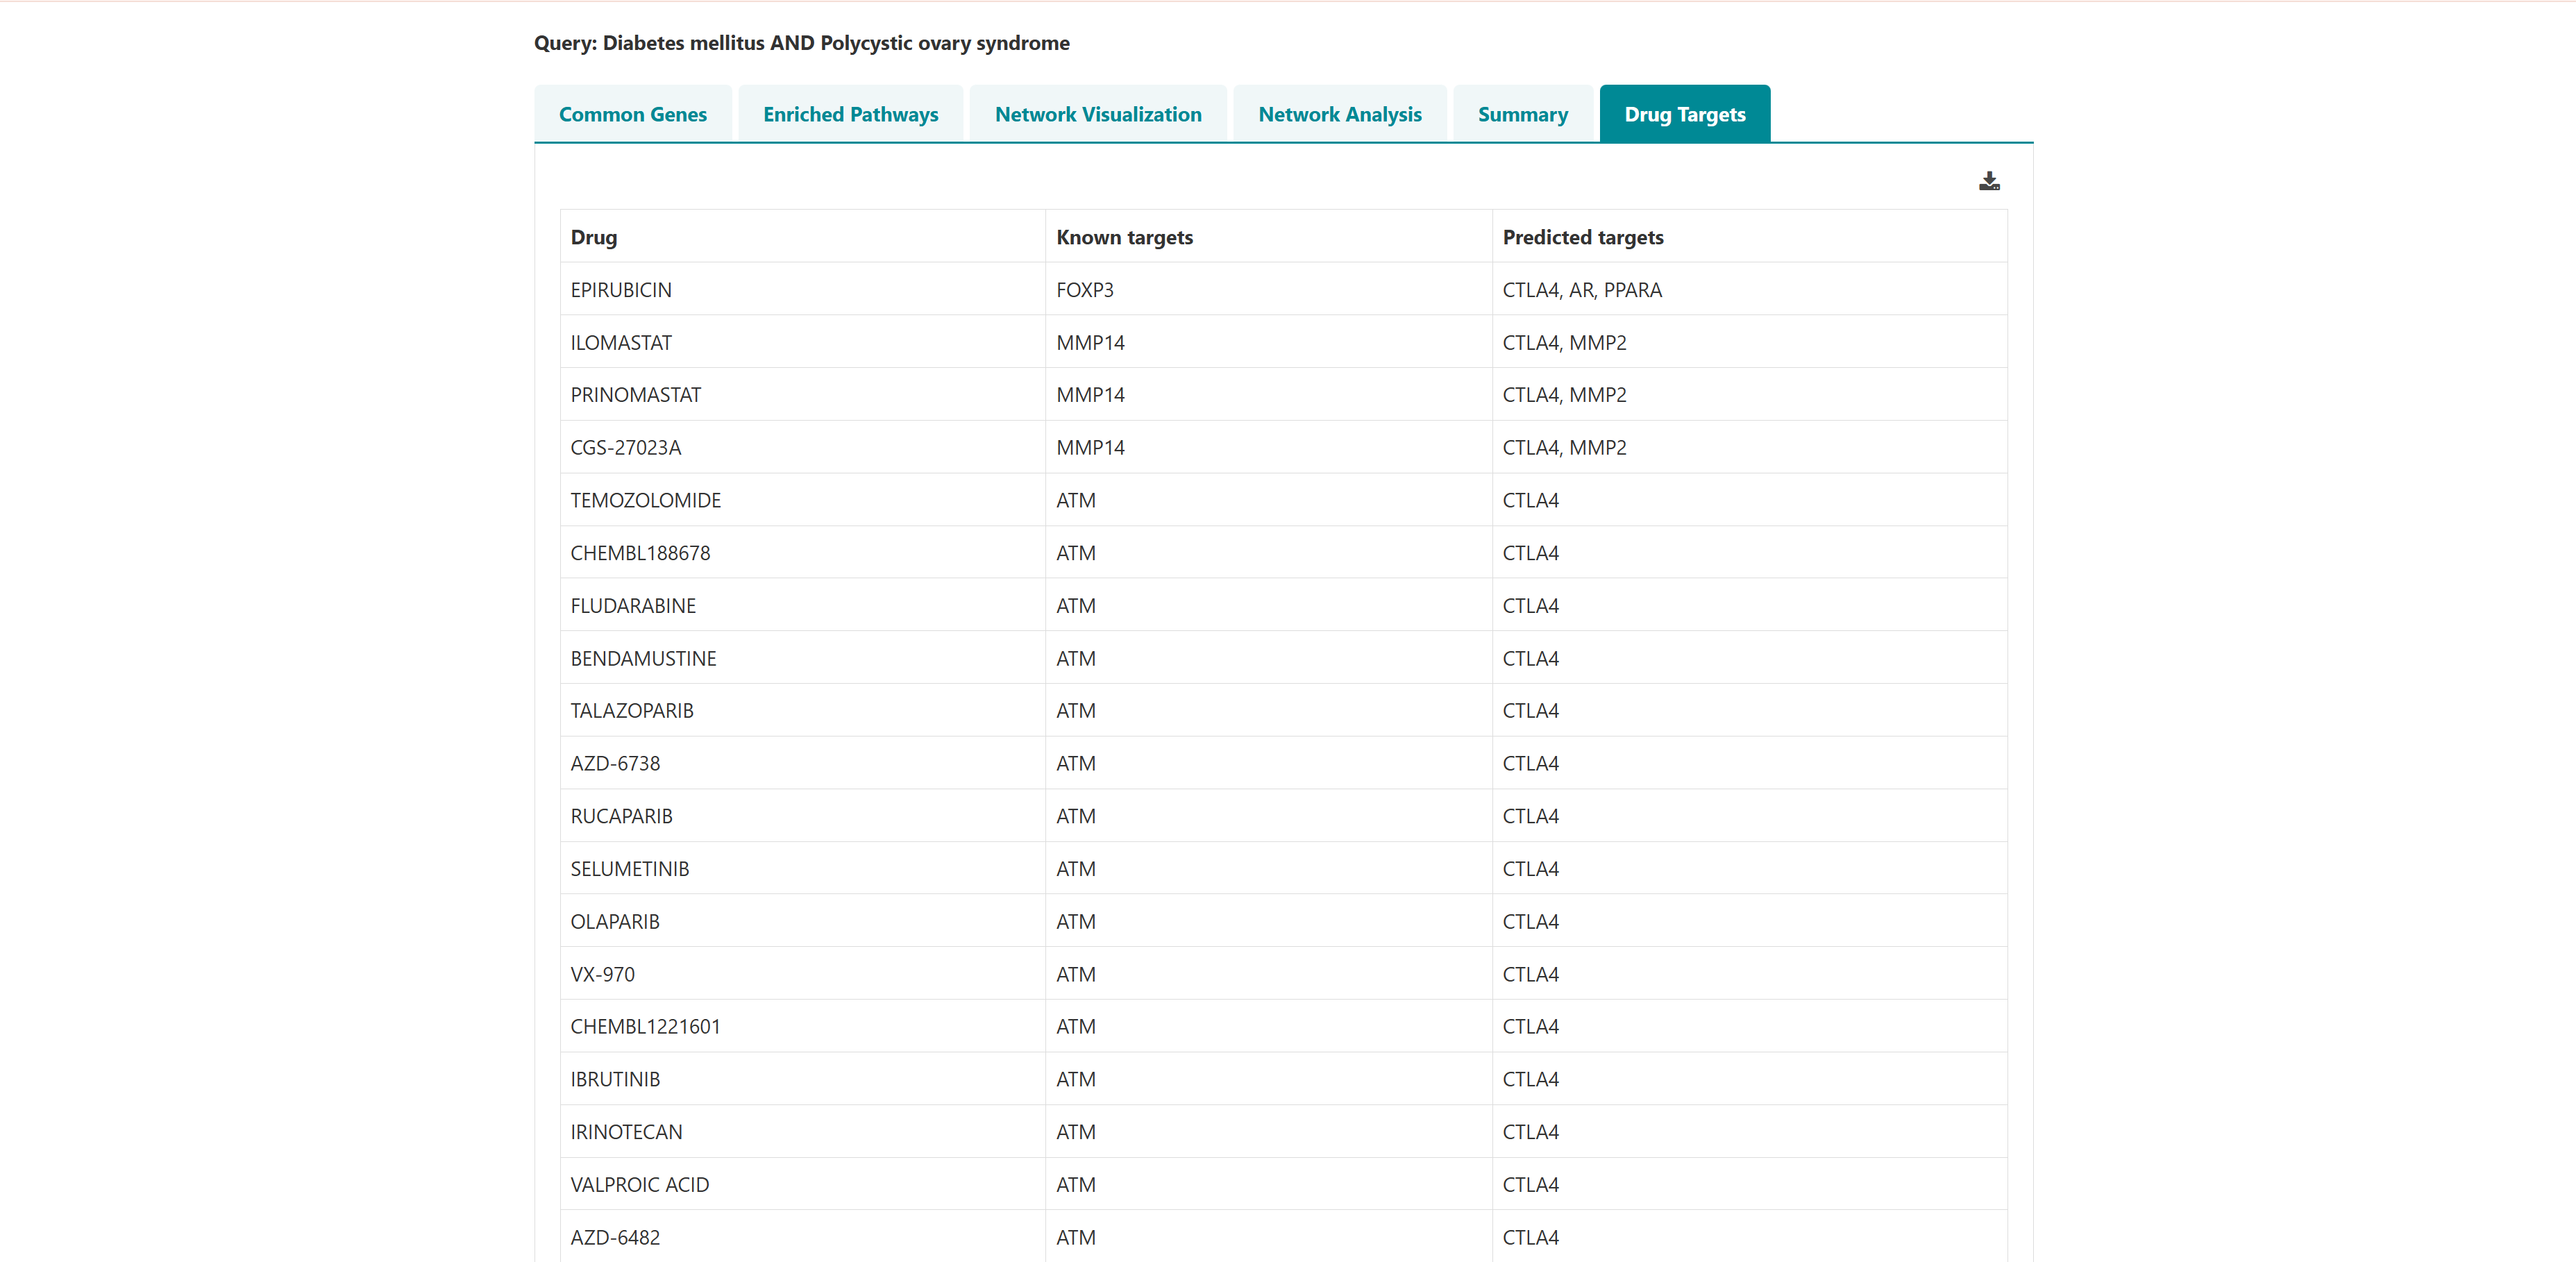
- I want to identify polypharmacological targets for a list of diseases: To identify common therapeutic targets from shared genes among comorbid conditions through pathway and network analysis to predict potential drugs.
- I want to identify common genes and pathways for a list of diseases: To identify common and unique genes, pathways etc through visual Venn diagram analysis for a list of diseases.
2. Browse
Users can navigate the Browse menu to explore genes, associated diseases, and pathway information from Reactome and KEGG.
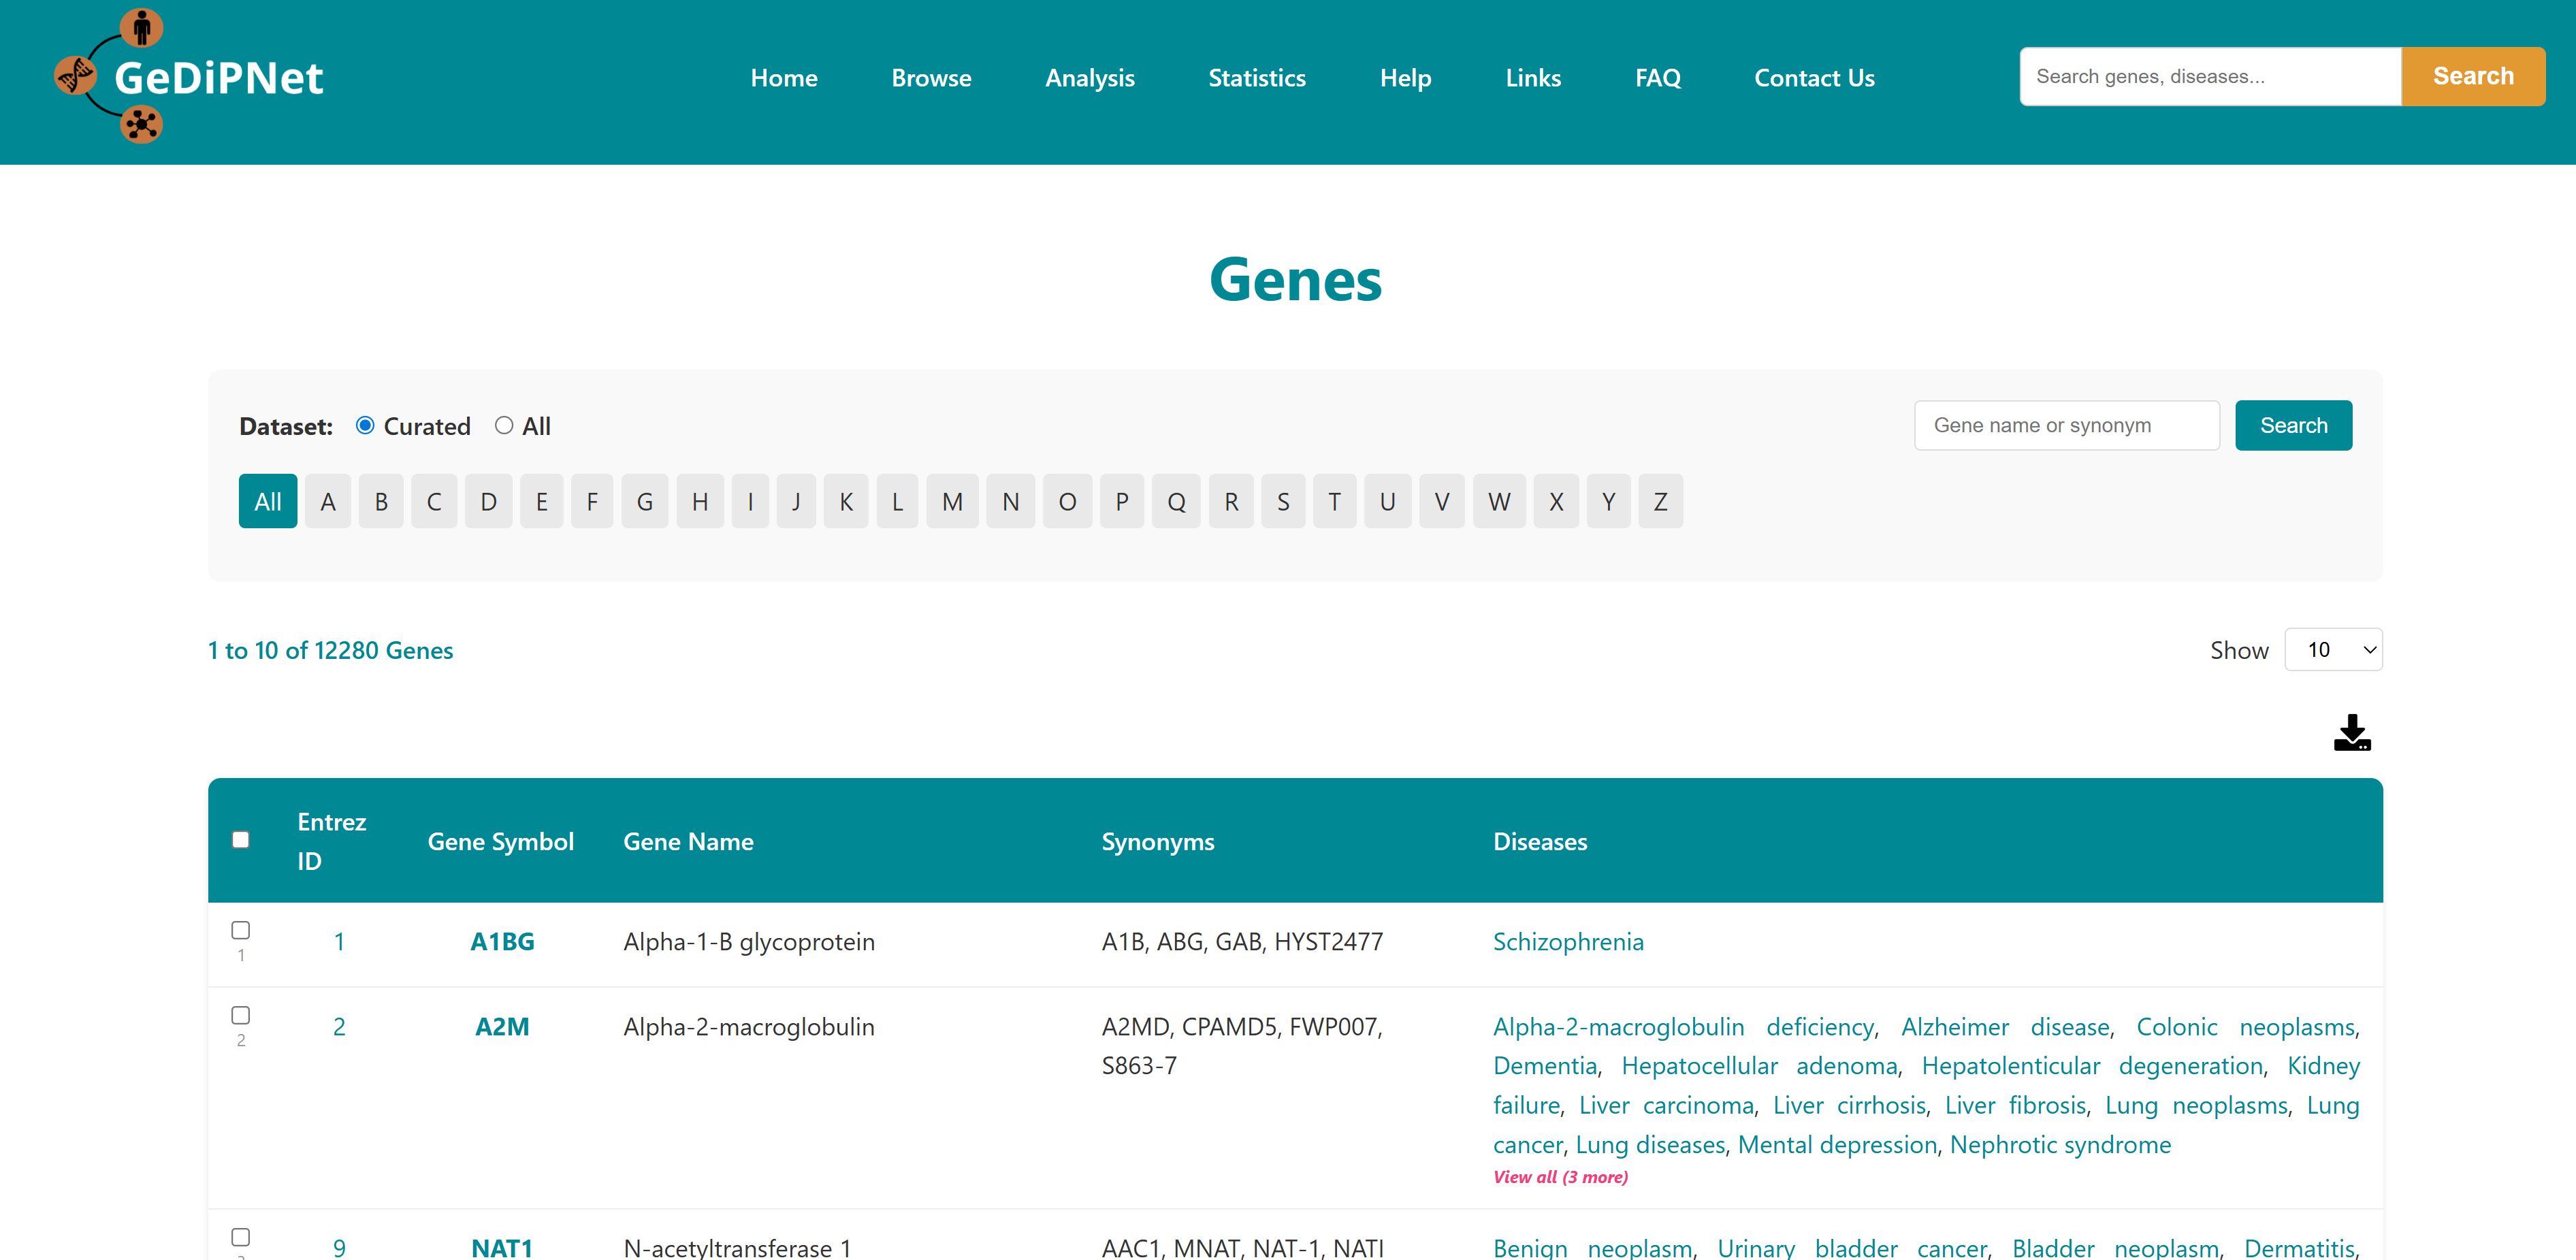
2.1 Genes
The Genes page offers an easy-to-use yet powerful interface for exploring detailed information about genes and their links to human diseases. You can filter results by selecting either "All" available genes or a specially "curated" set, and browse alphabetically using the A-Z buttons. Each gene is listed in a structured tabular format showing Entrez ID, gene symbol, gene name, synonyms, and the associated diseases. Links to the Disease page for the specific genes are provided. Users can download the entire table dataset or export only specifically chosen genes and entries, with all data available in TSV (Tab-Separated Values) format.
2.2 Diseases
The diseases associated with genes present in the database can be viewed using this option. Every record is hyperlinked to a disease information page, where all terms associated with the disease name, associated ids, gene symbols and references are available. Links to the Disease page and associated genes are provided. Users can download the entire table dataset or export only specifically chosen diseases and entries, with all data available in TSV (Tab-Separated Values) format using the download button on top right in the control section.
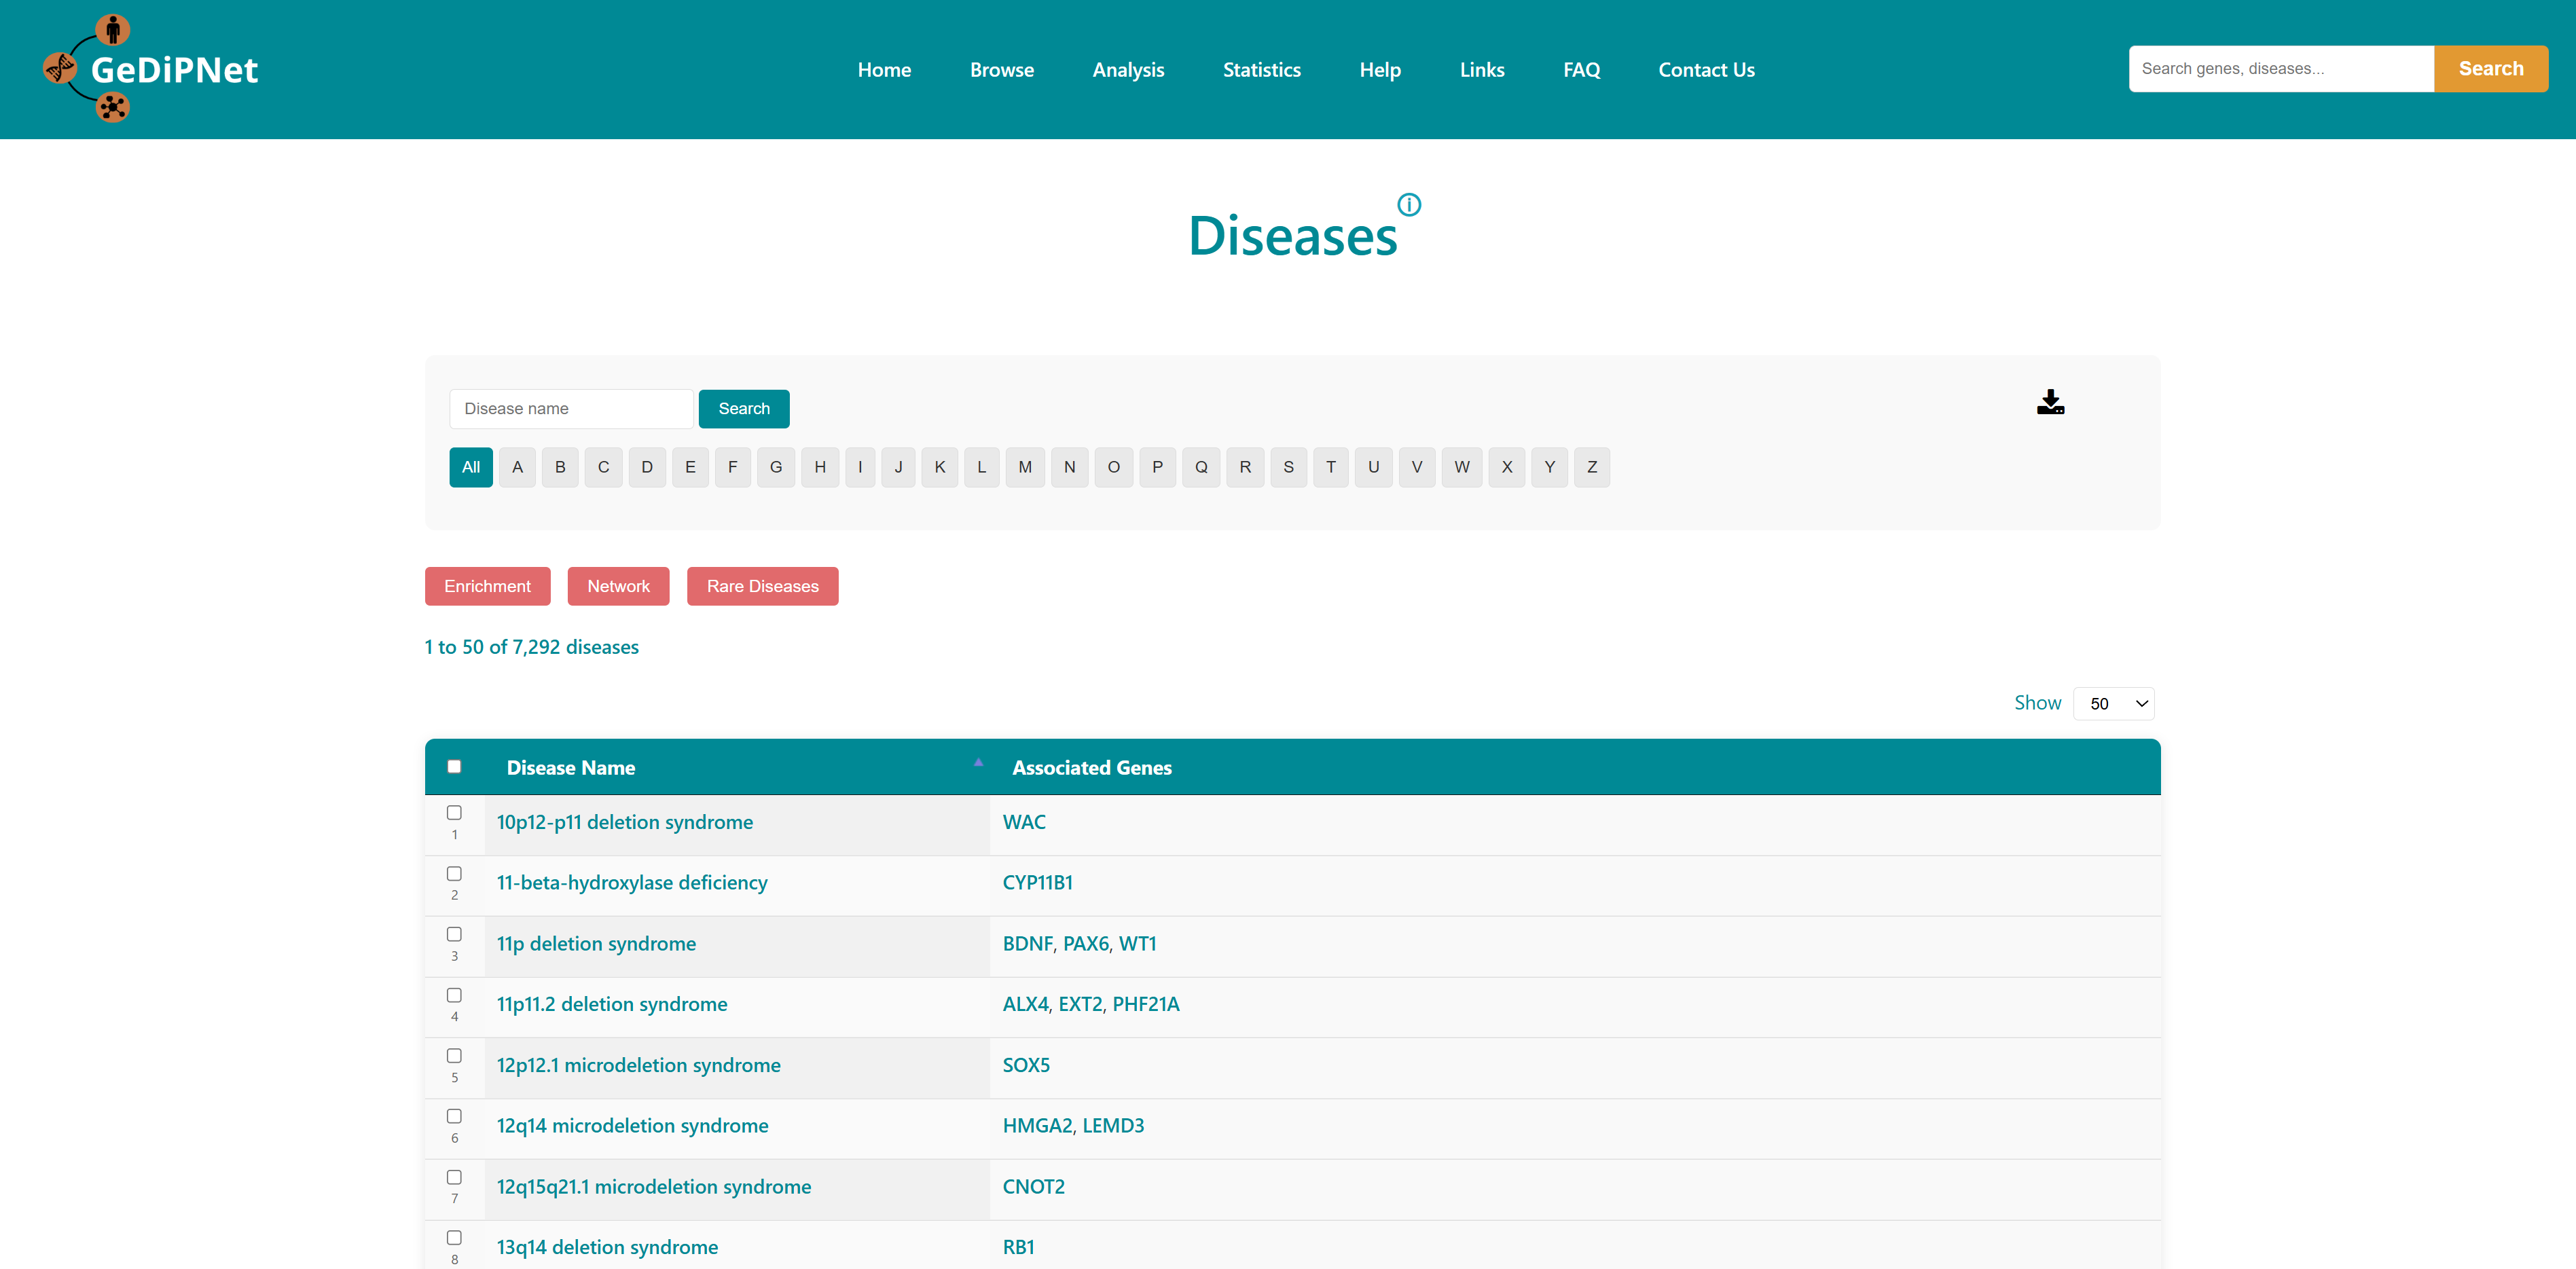
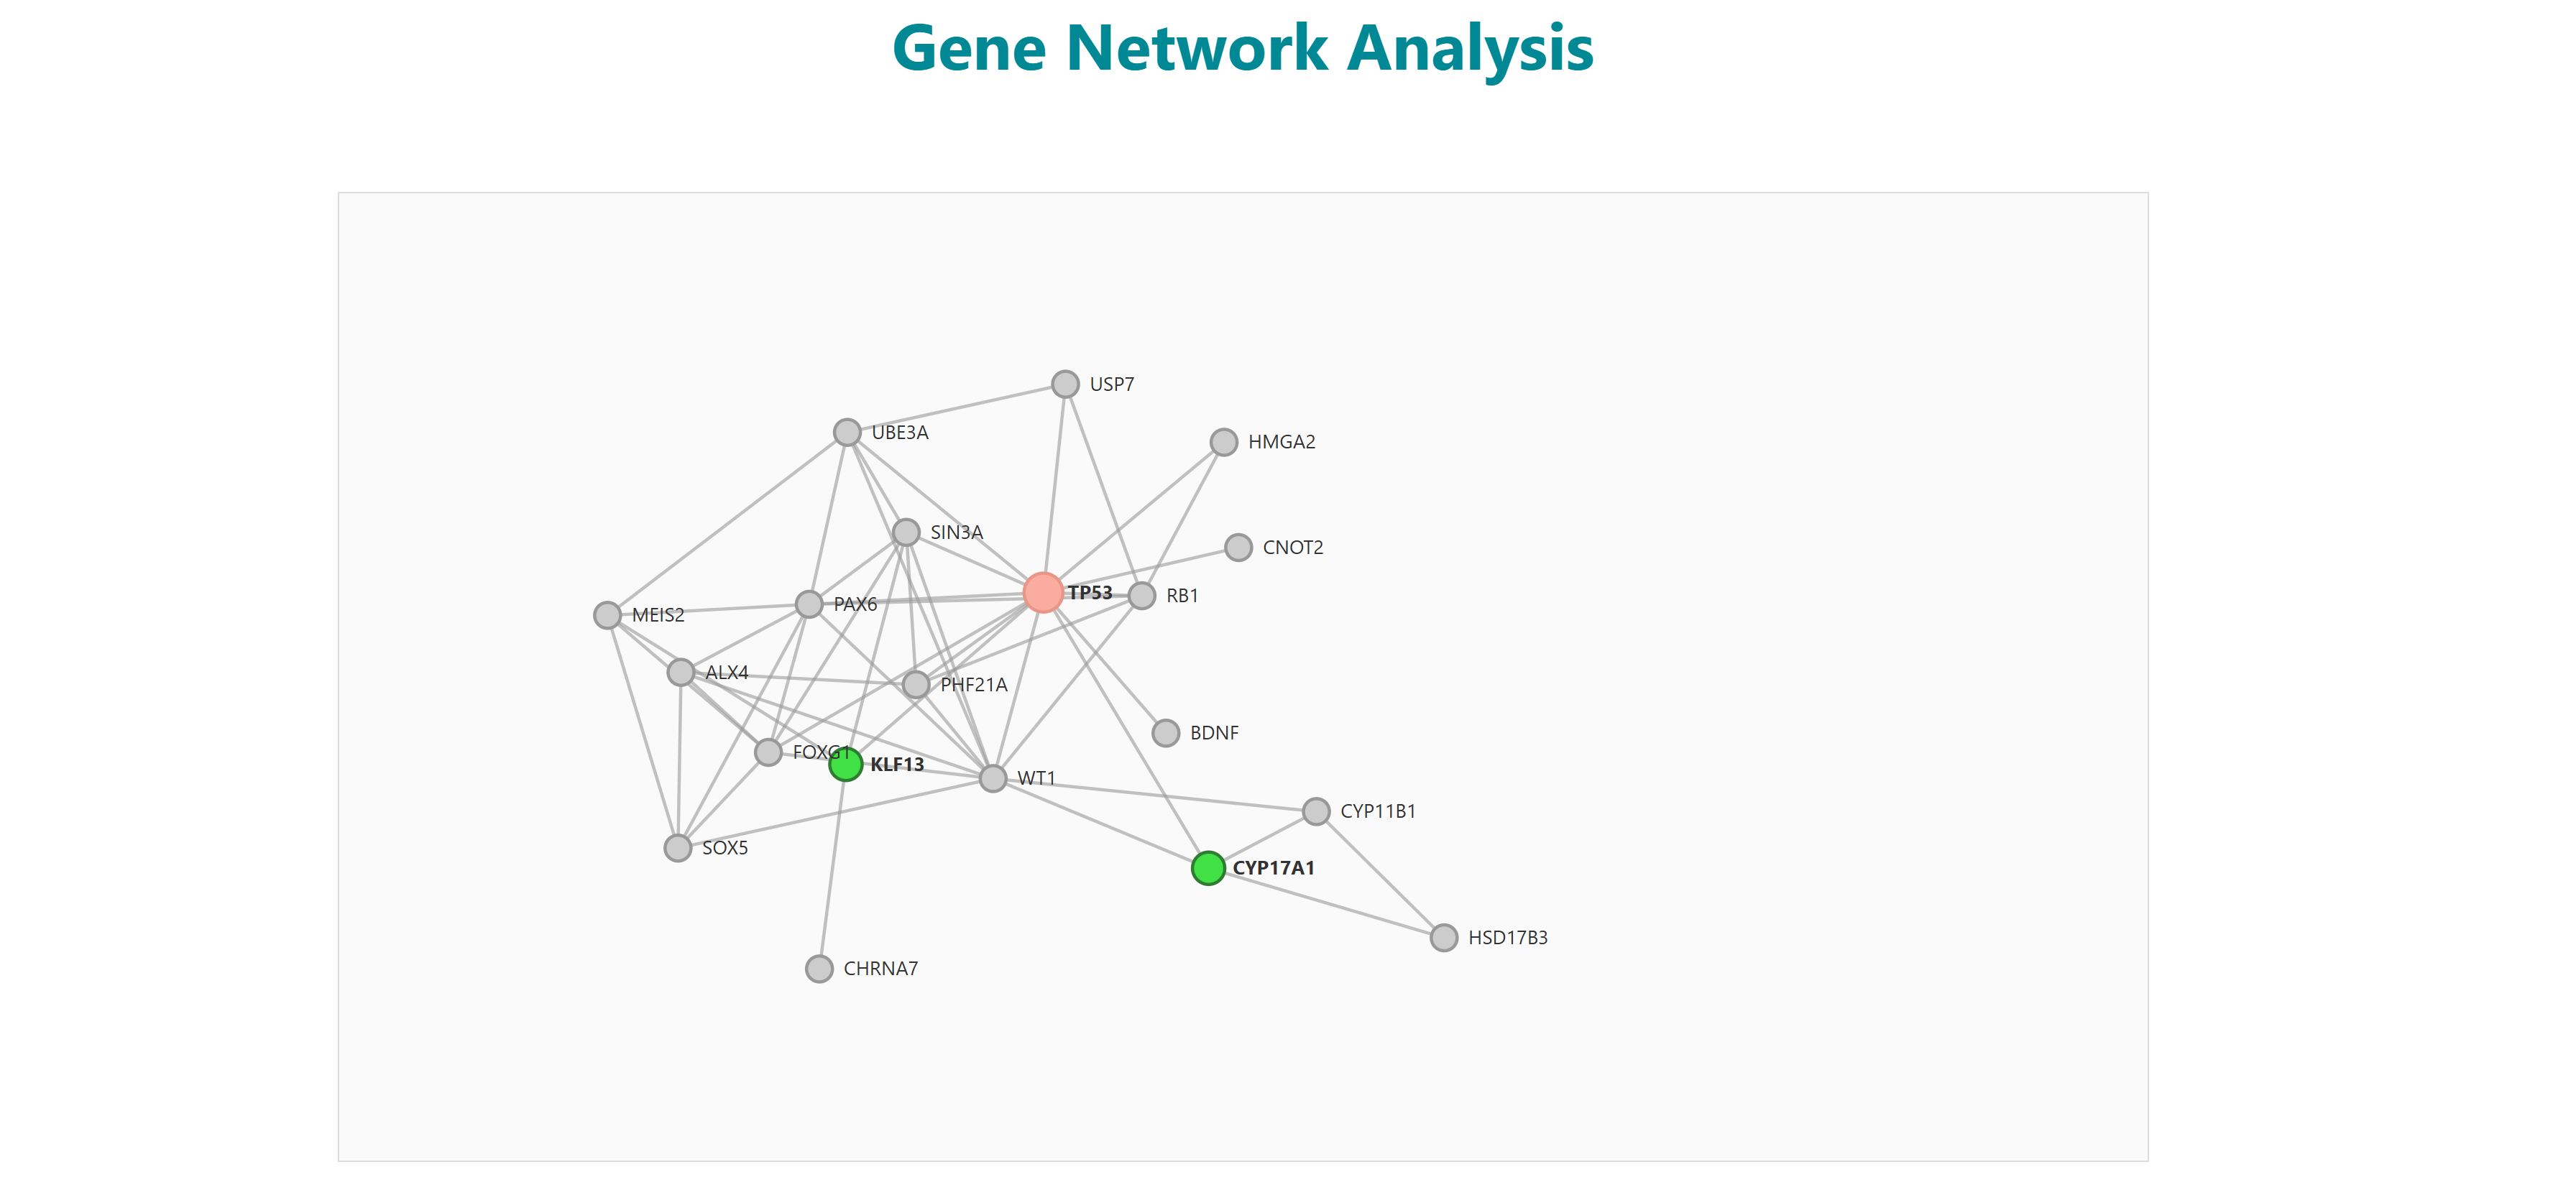
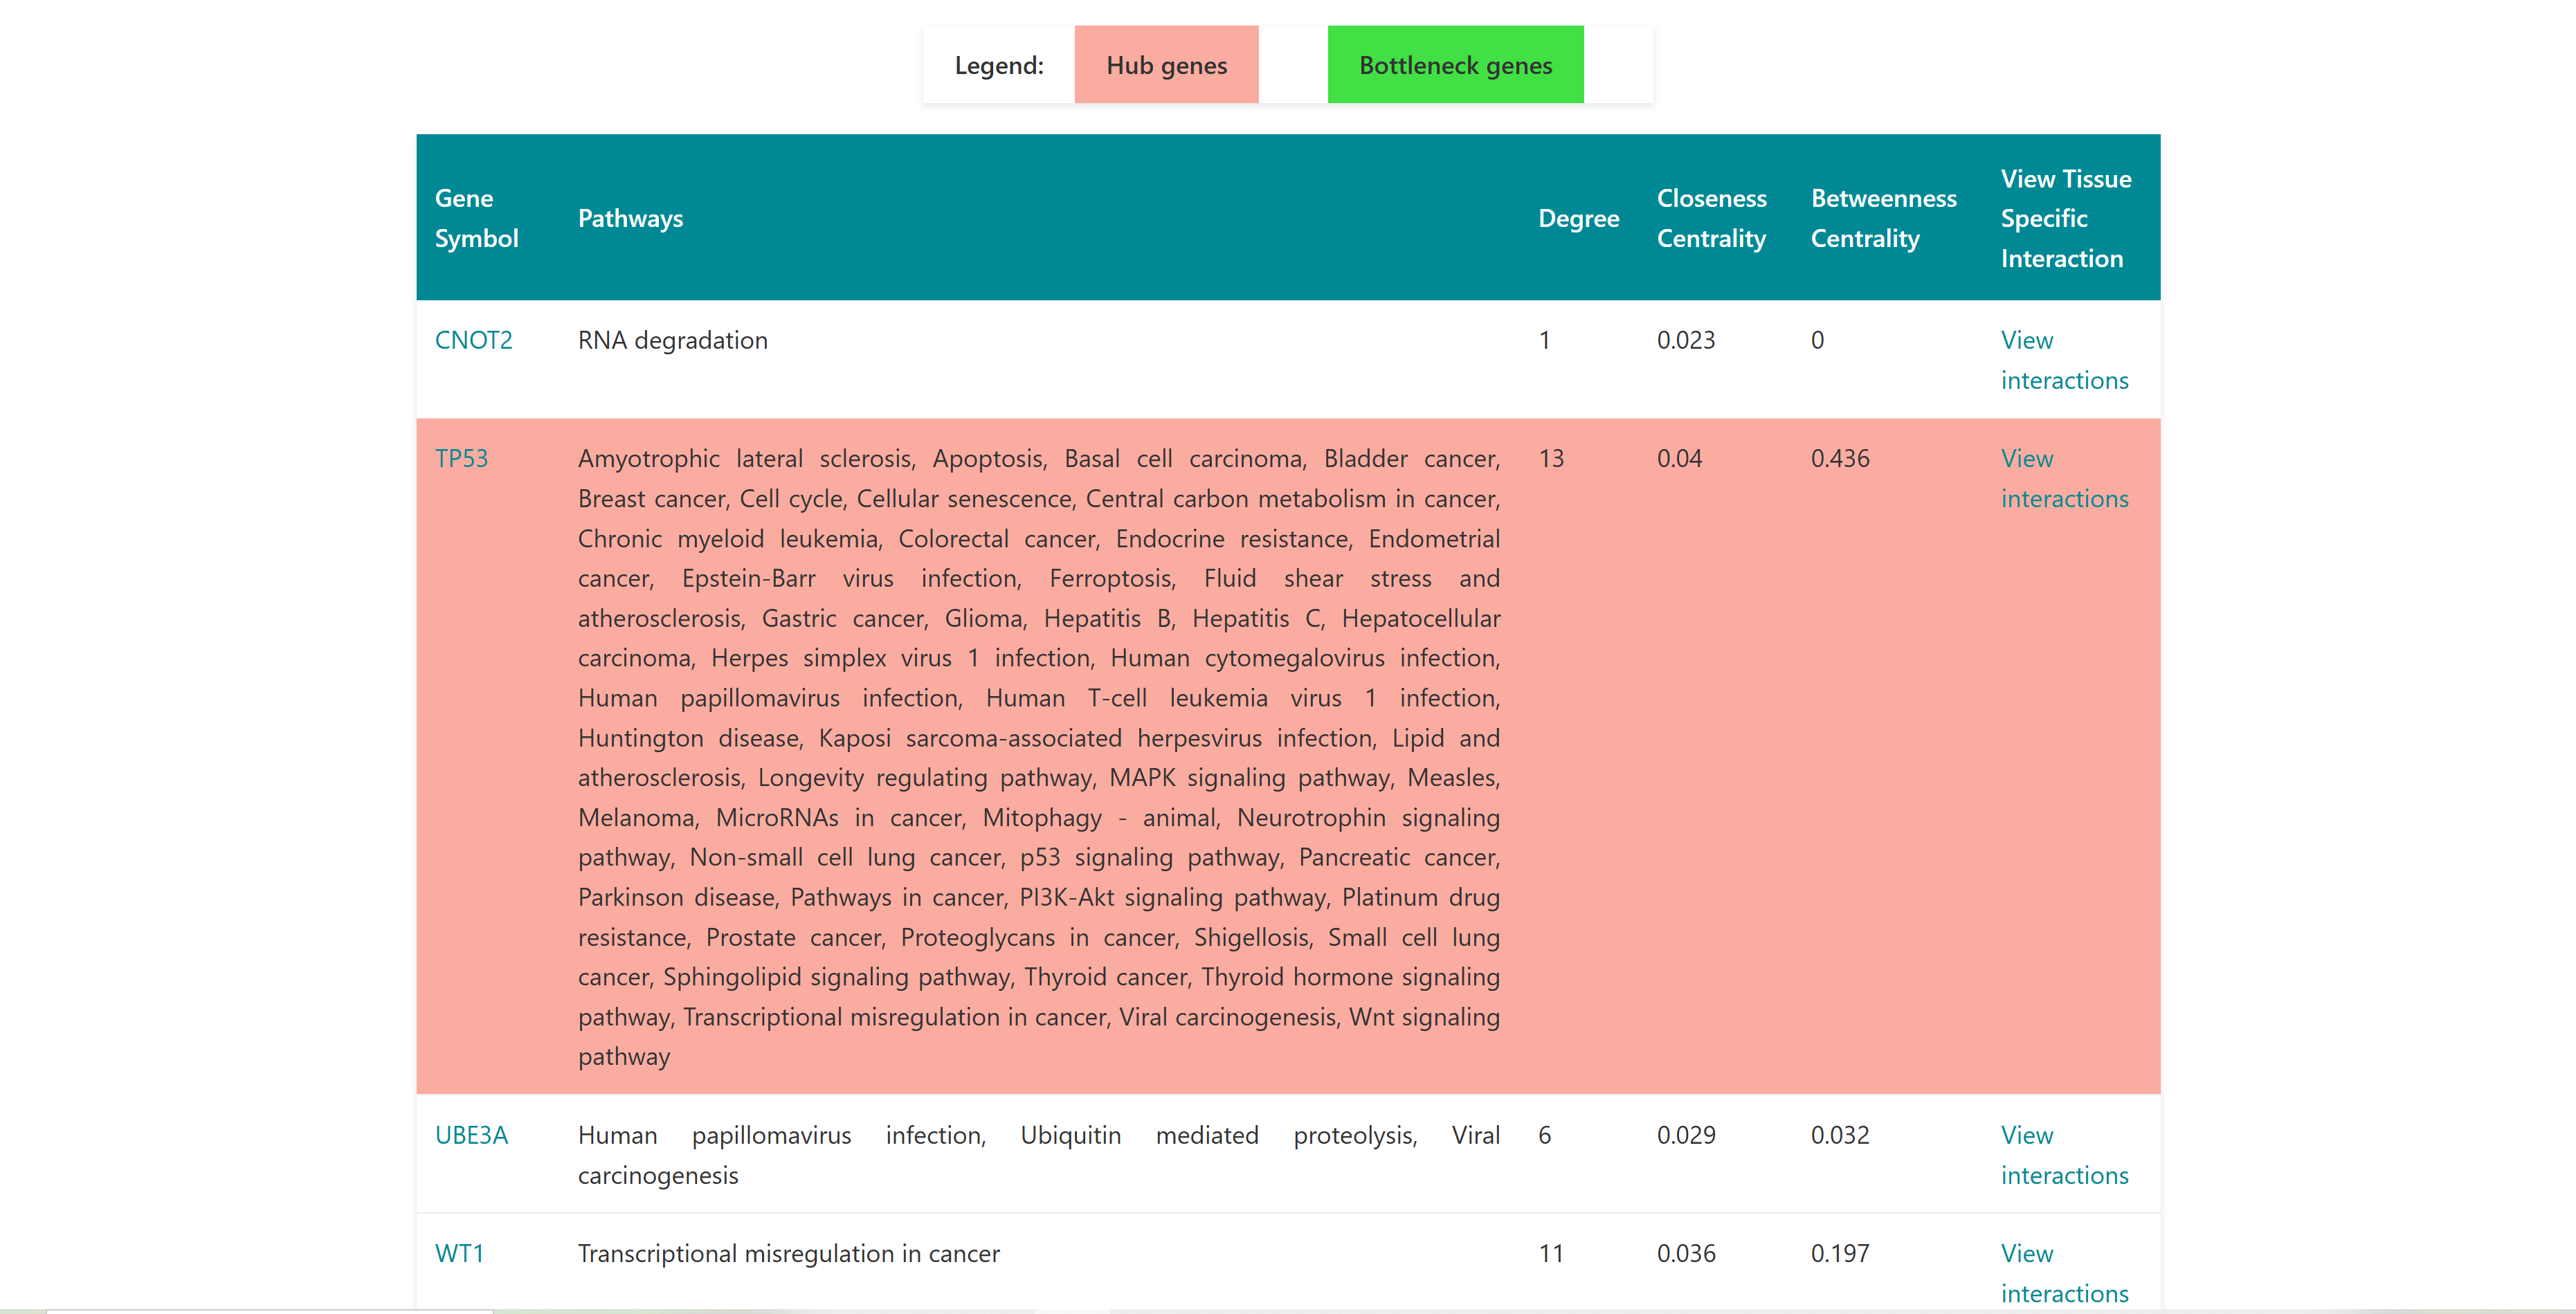
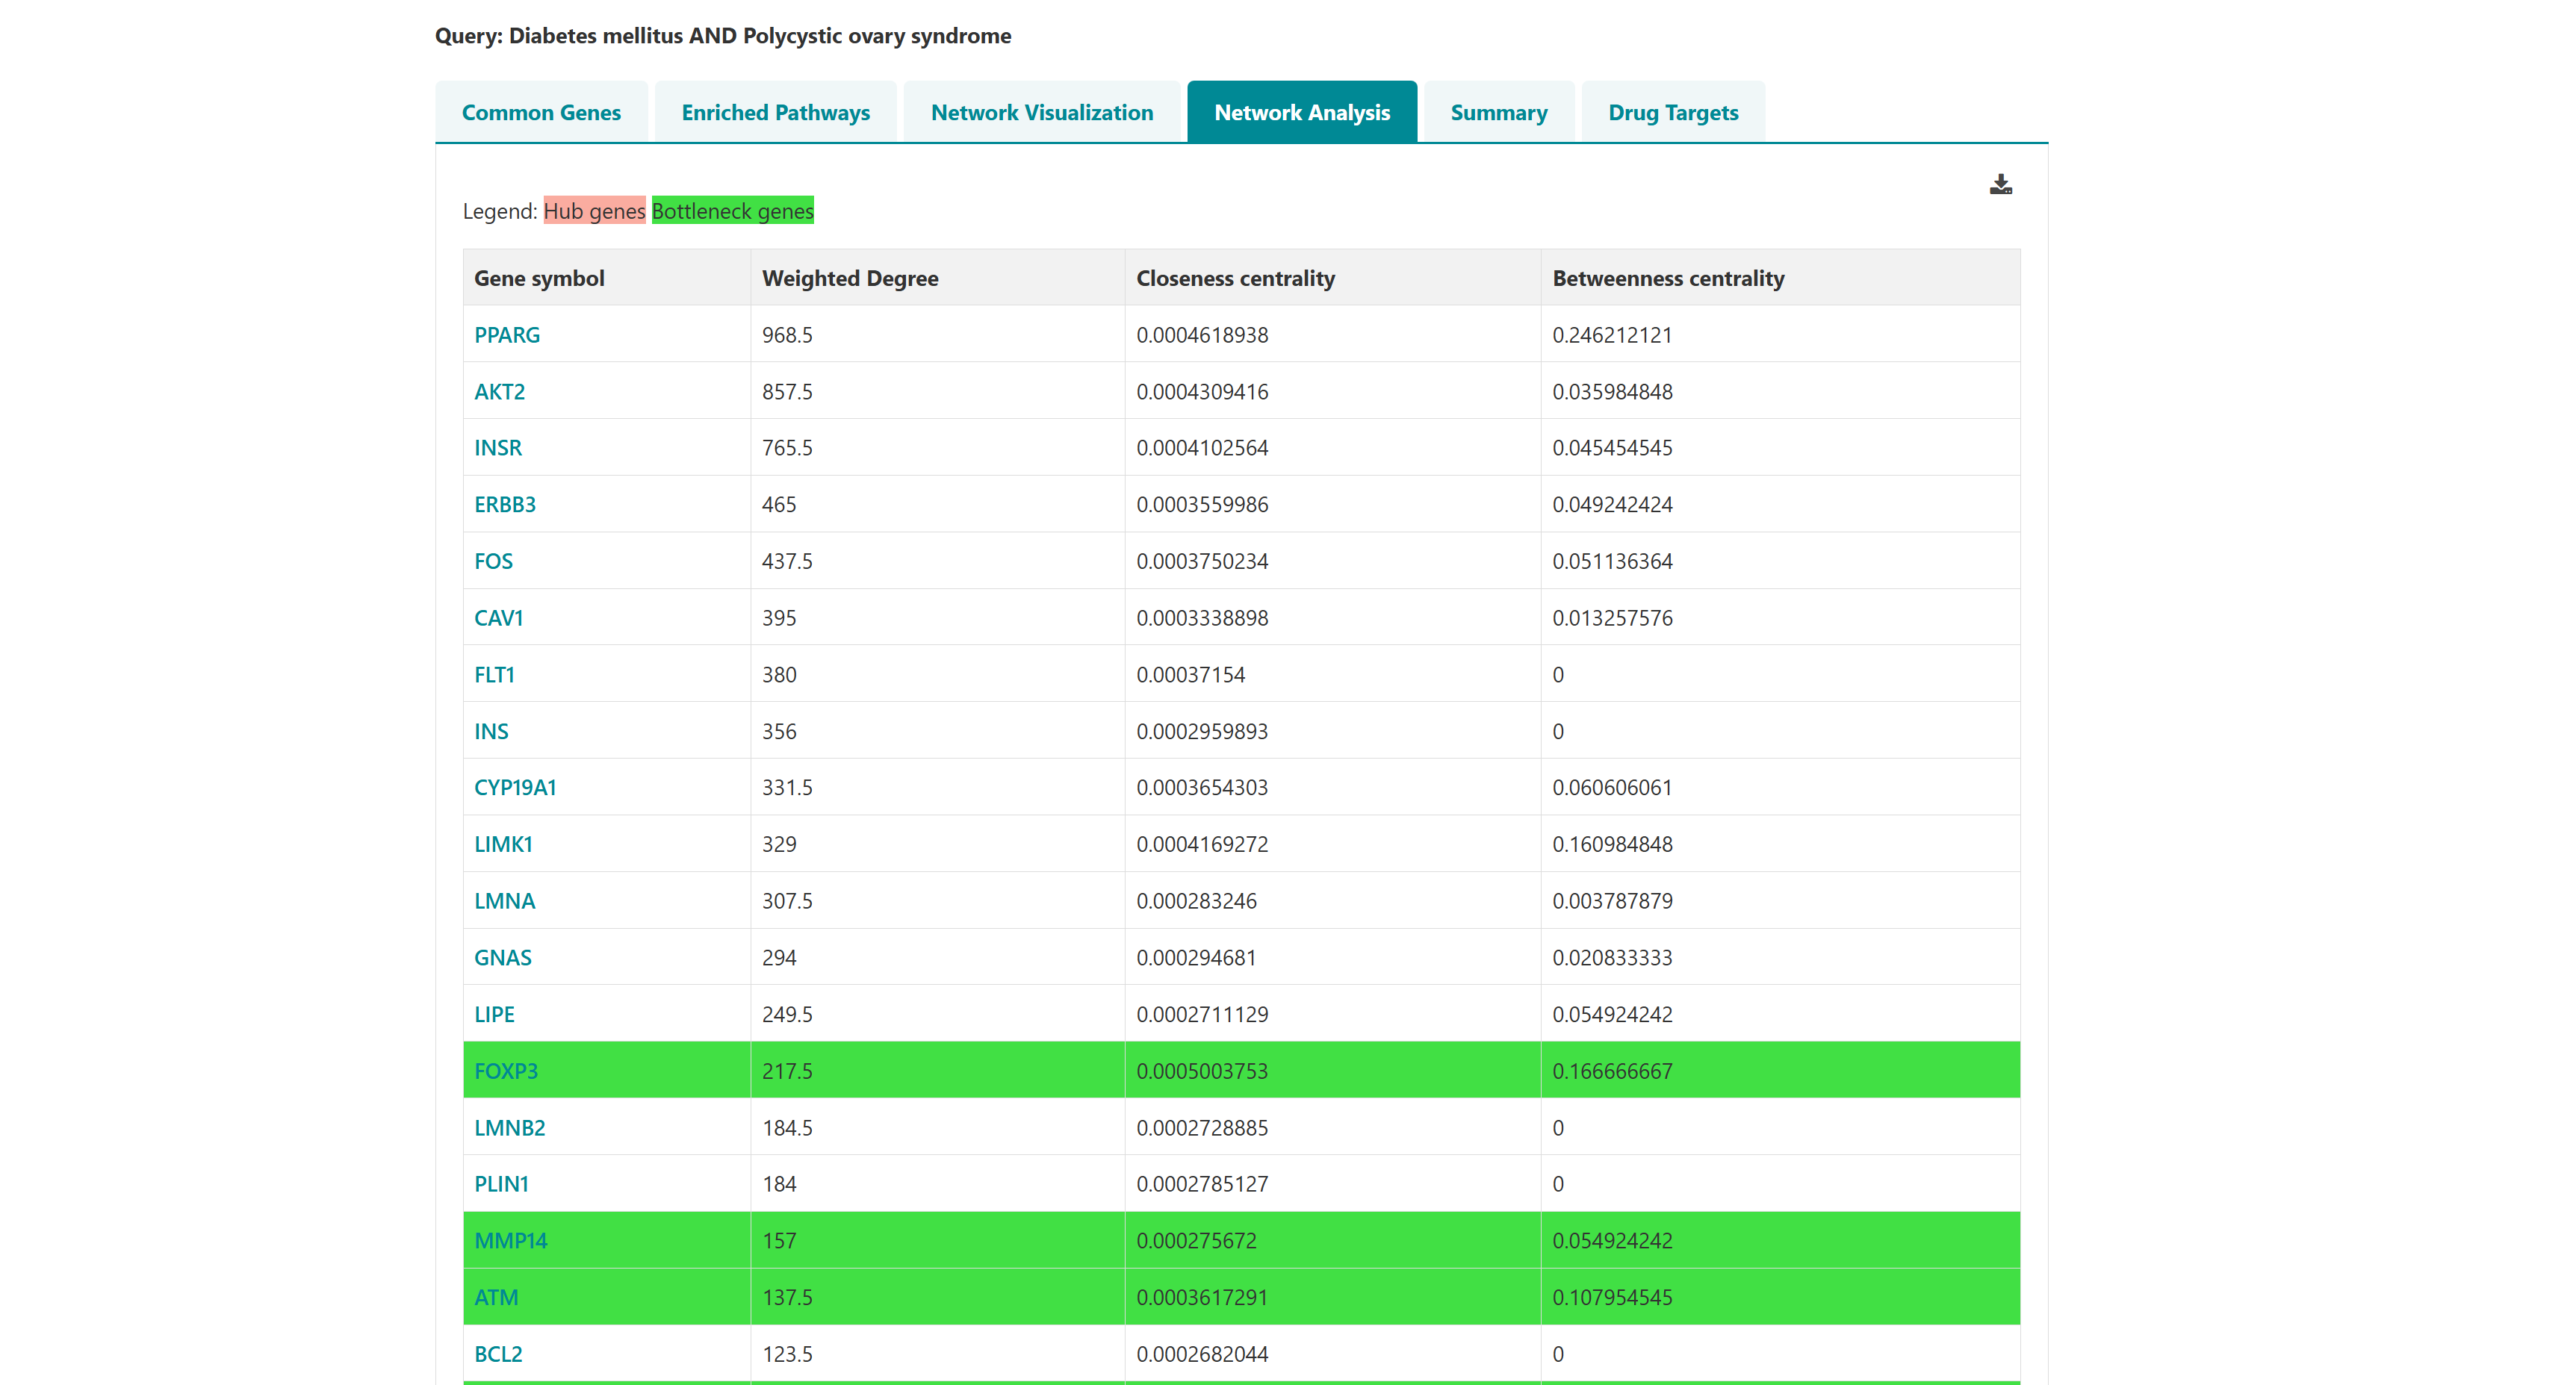
Users can select diseases to do enrichment analysis, gene network analysis. The selected diseases genes will redirect to enrichment page on clicking on enrichment button. The network button represents the enriched genes (and bottleneck and hub genes) of the selected diseases associated genes. They're displayed in the order of the three scores: degree, closeness centrality and betweeness centrality. A "view interaction" button under the "View tissue specific interaction" column in the table. By clicking on it, a tissue specific interaction network is obtained.
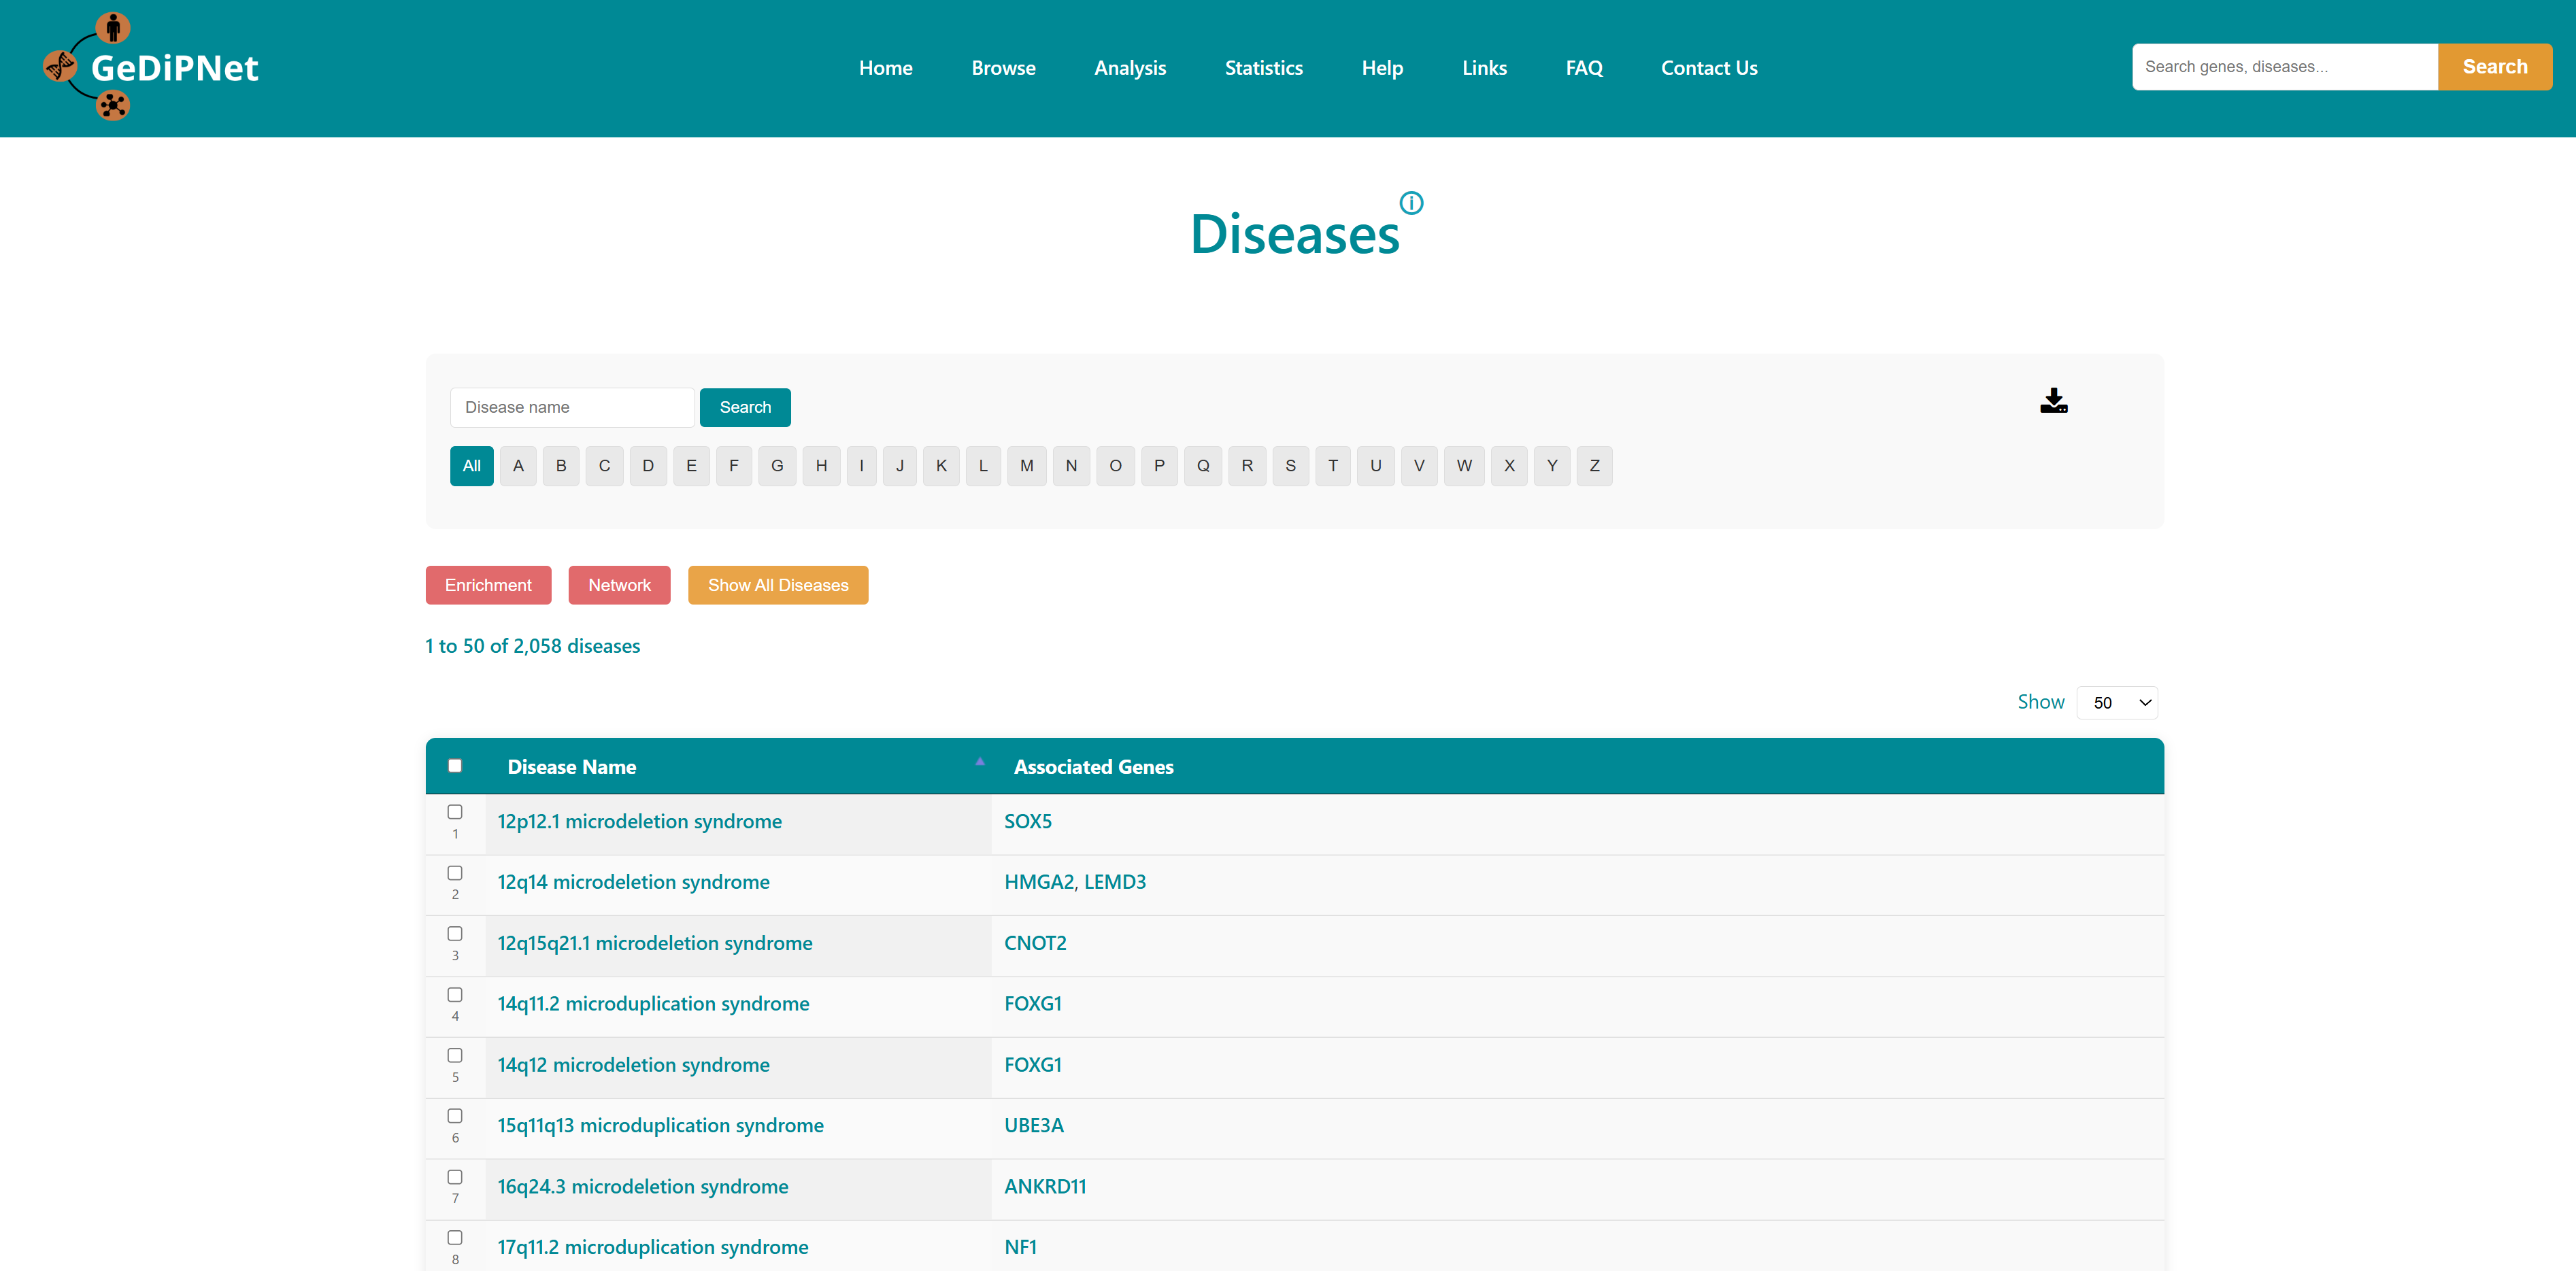
The Rare Diseases tab displays a list of rare diseases available in GeDiPNet. Users can return to viewing all diseases by clicking the 'Show All Diseases' button.
2.3 Pathways
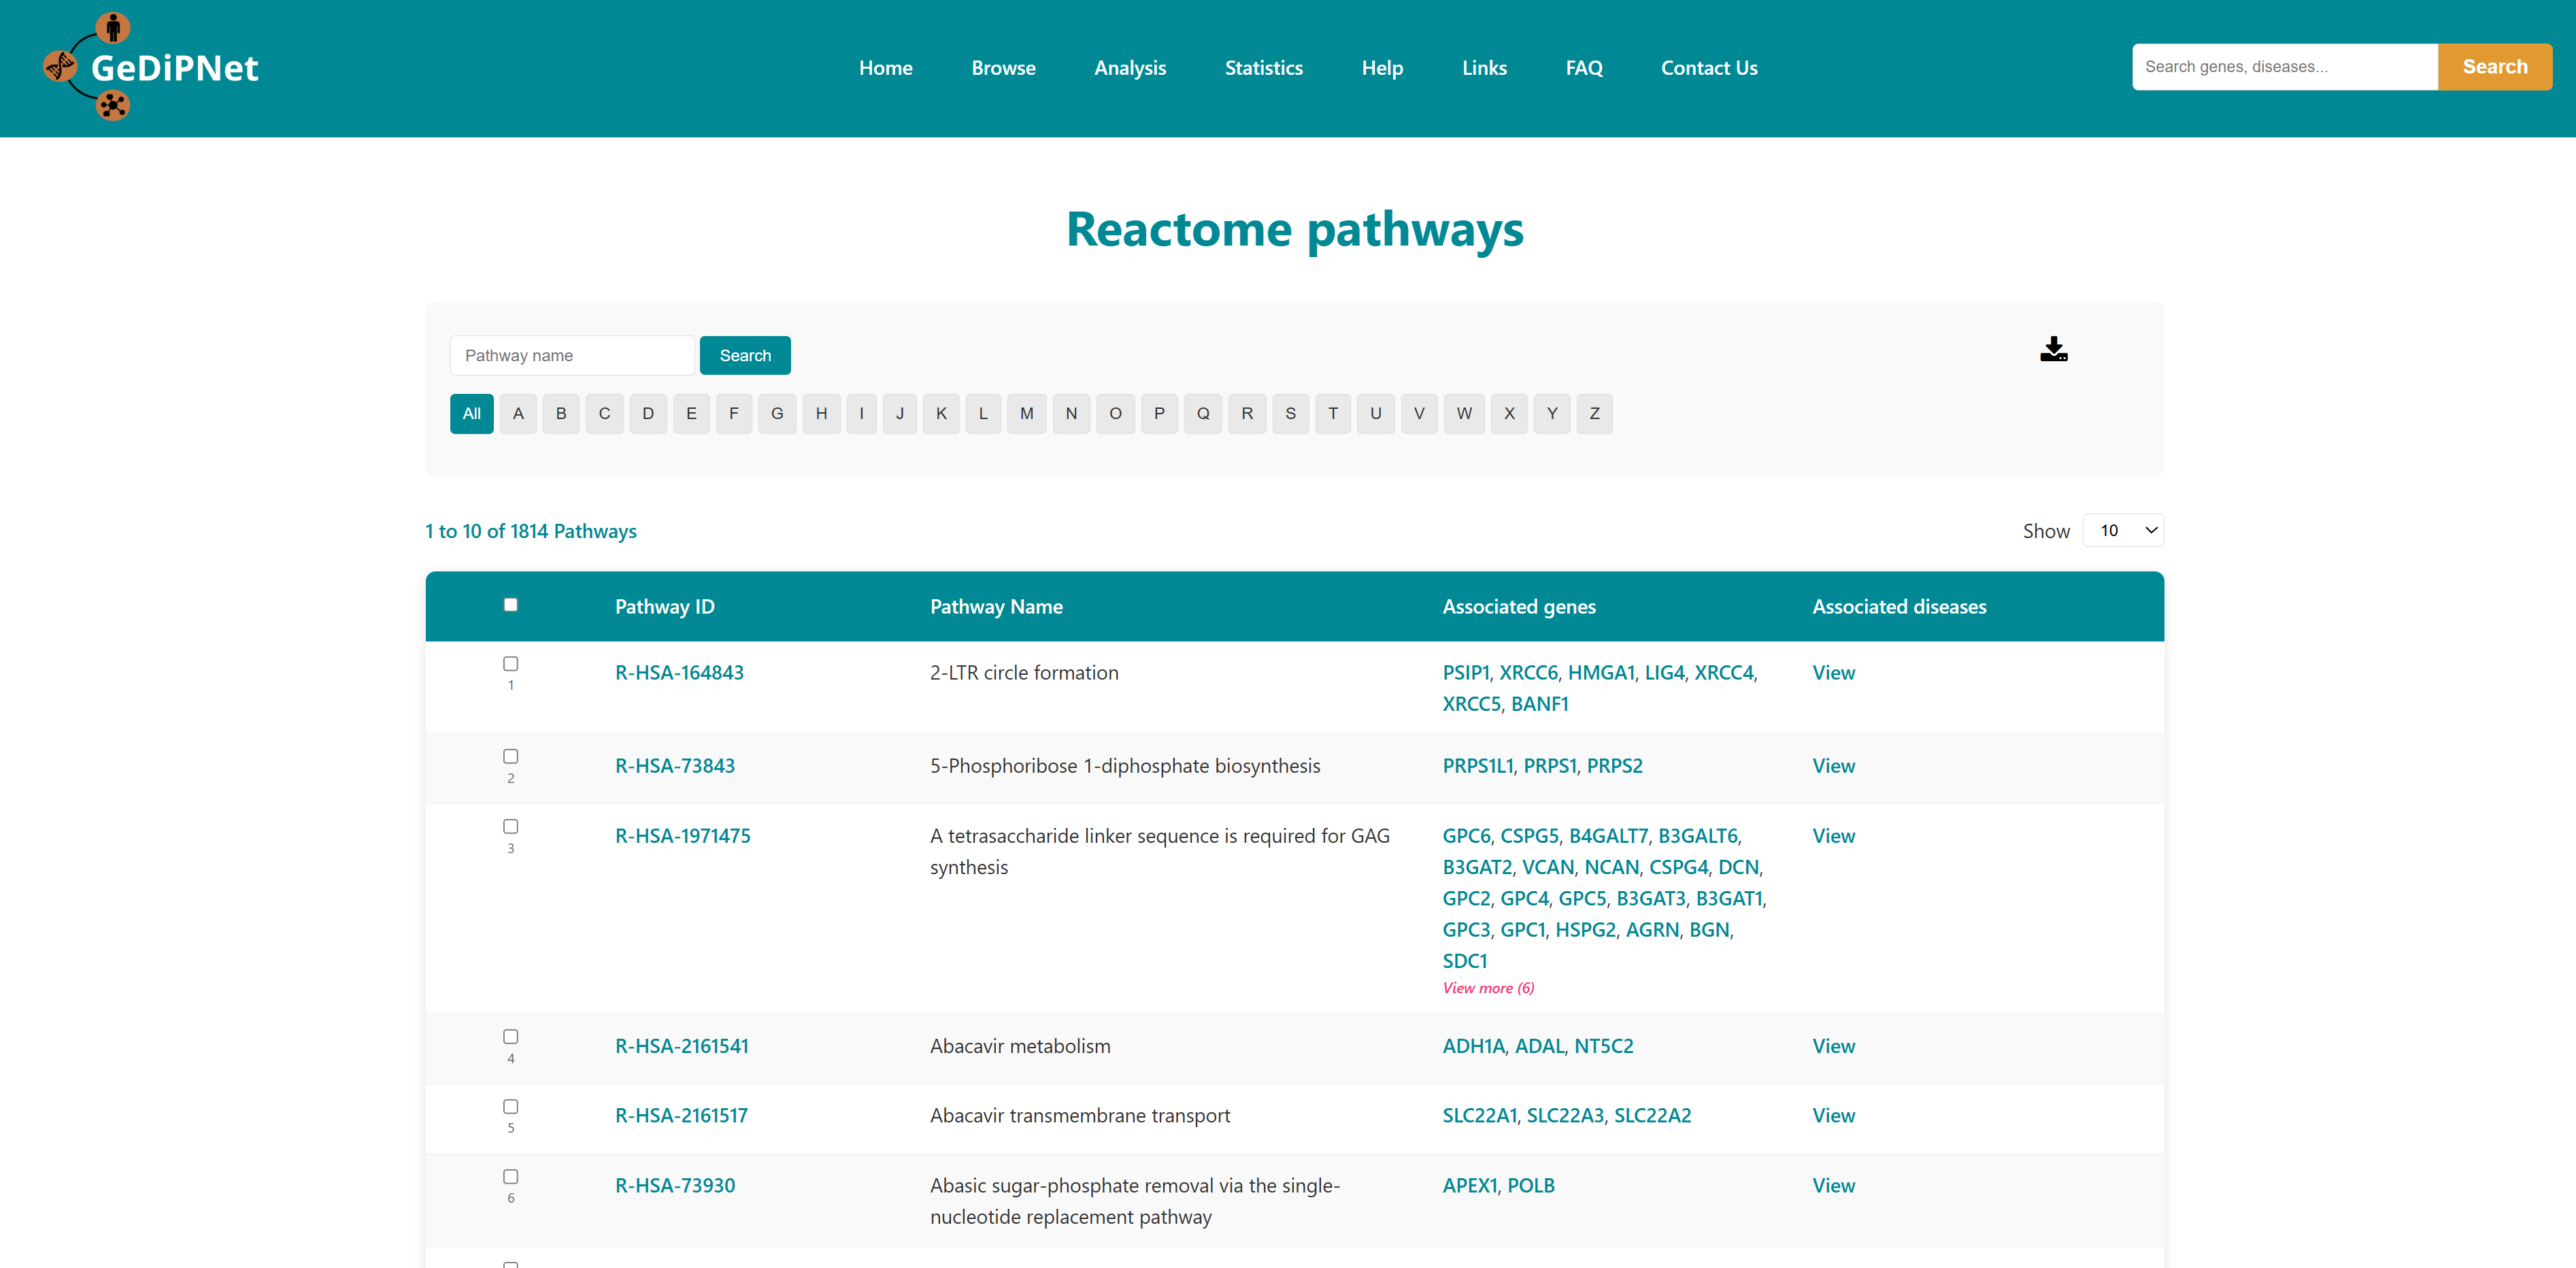
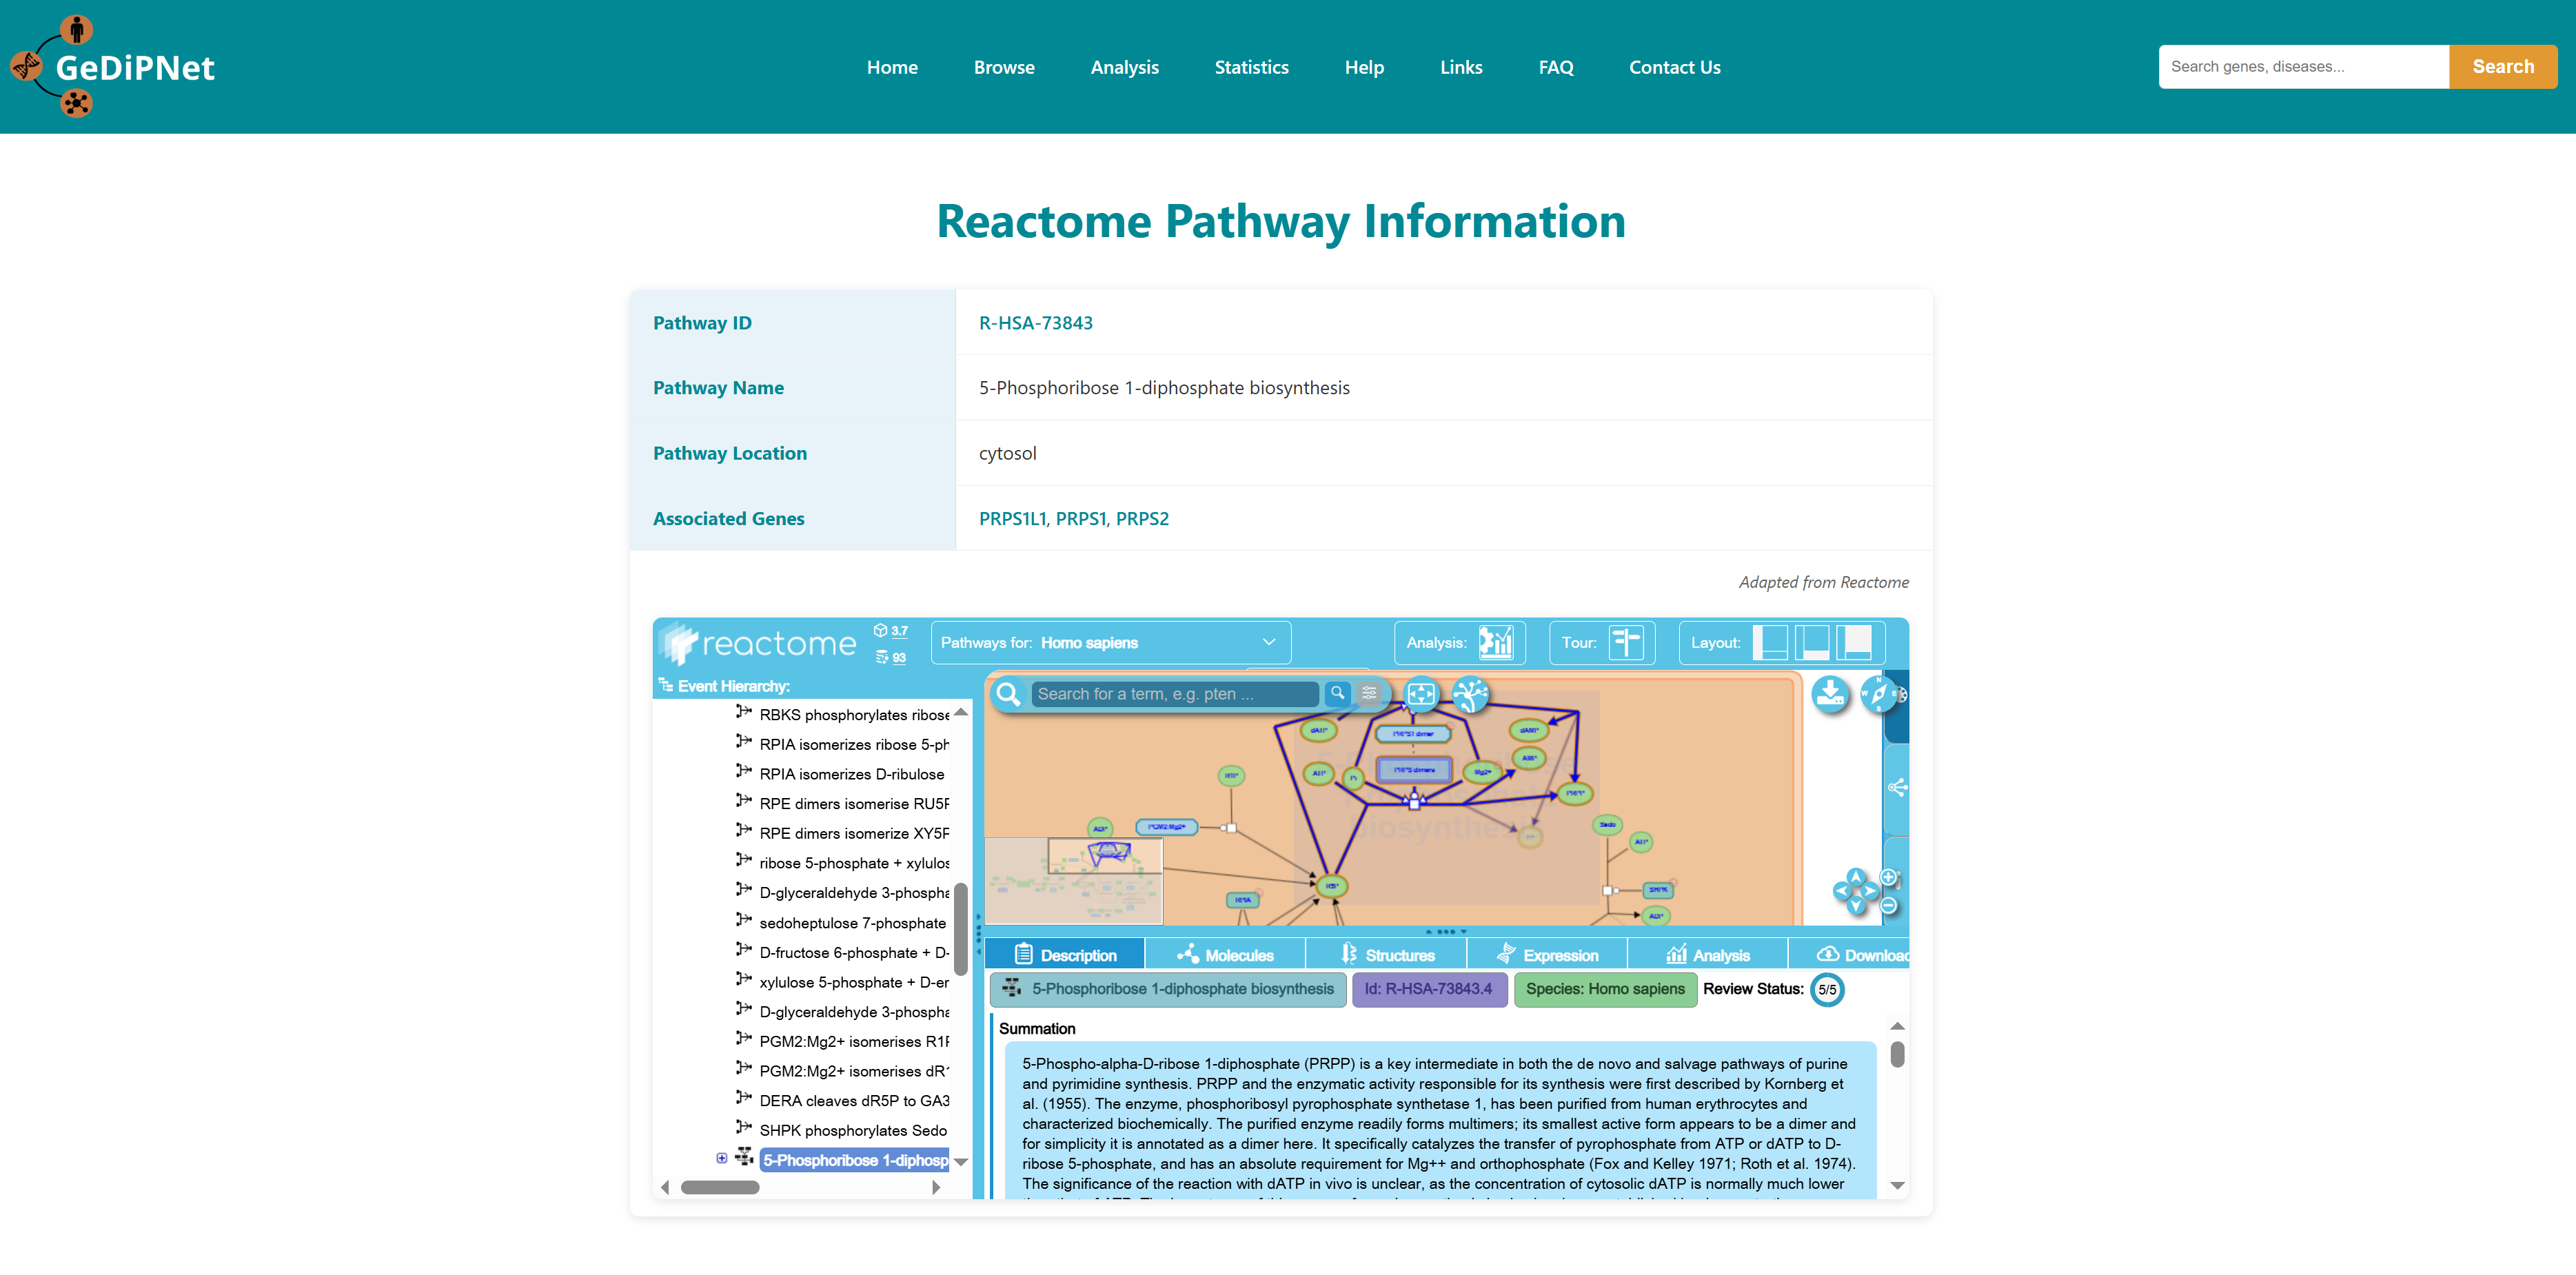
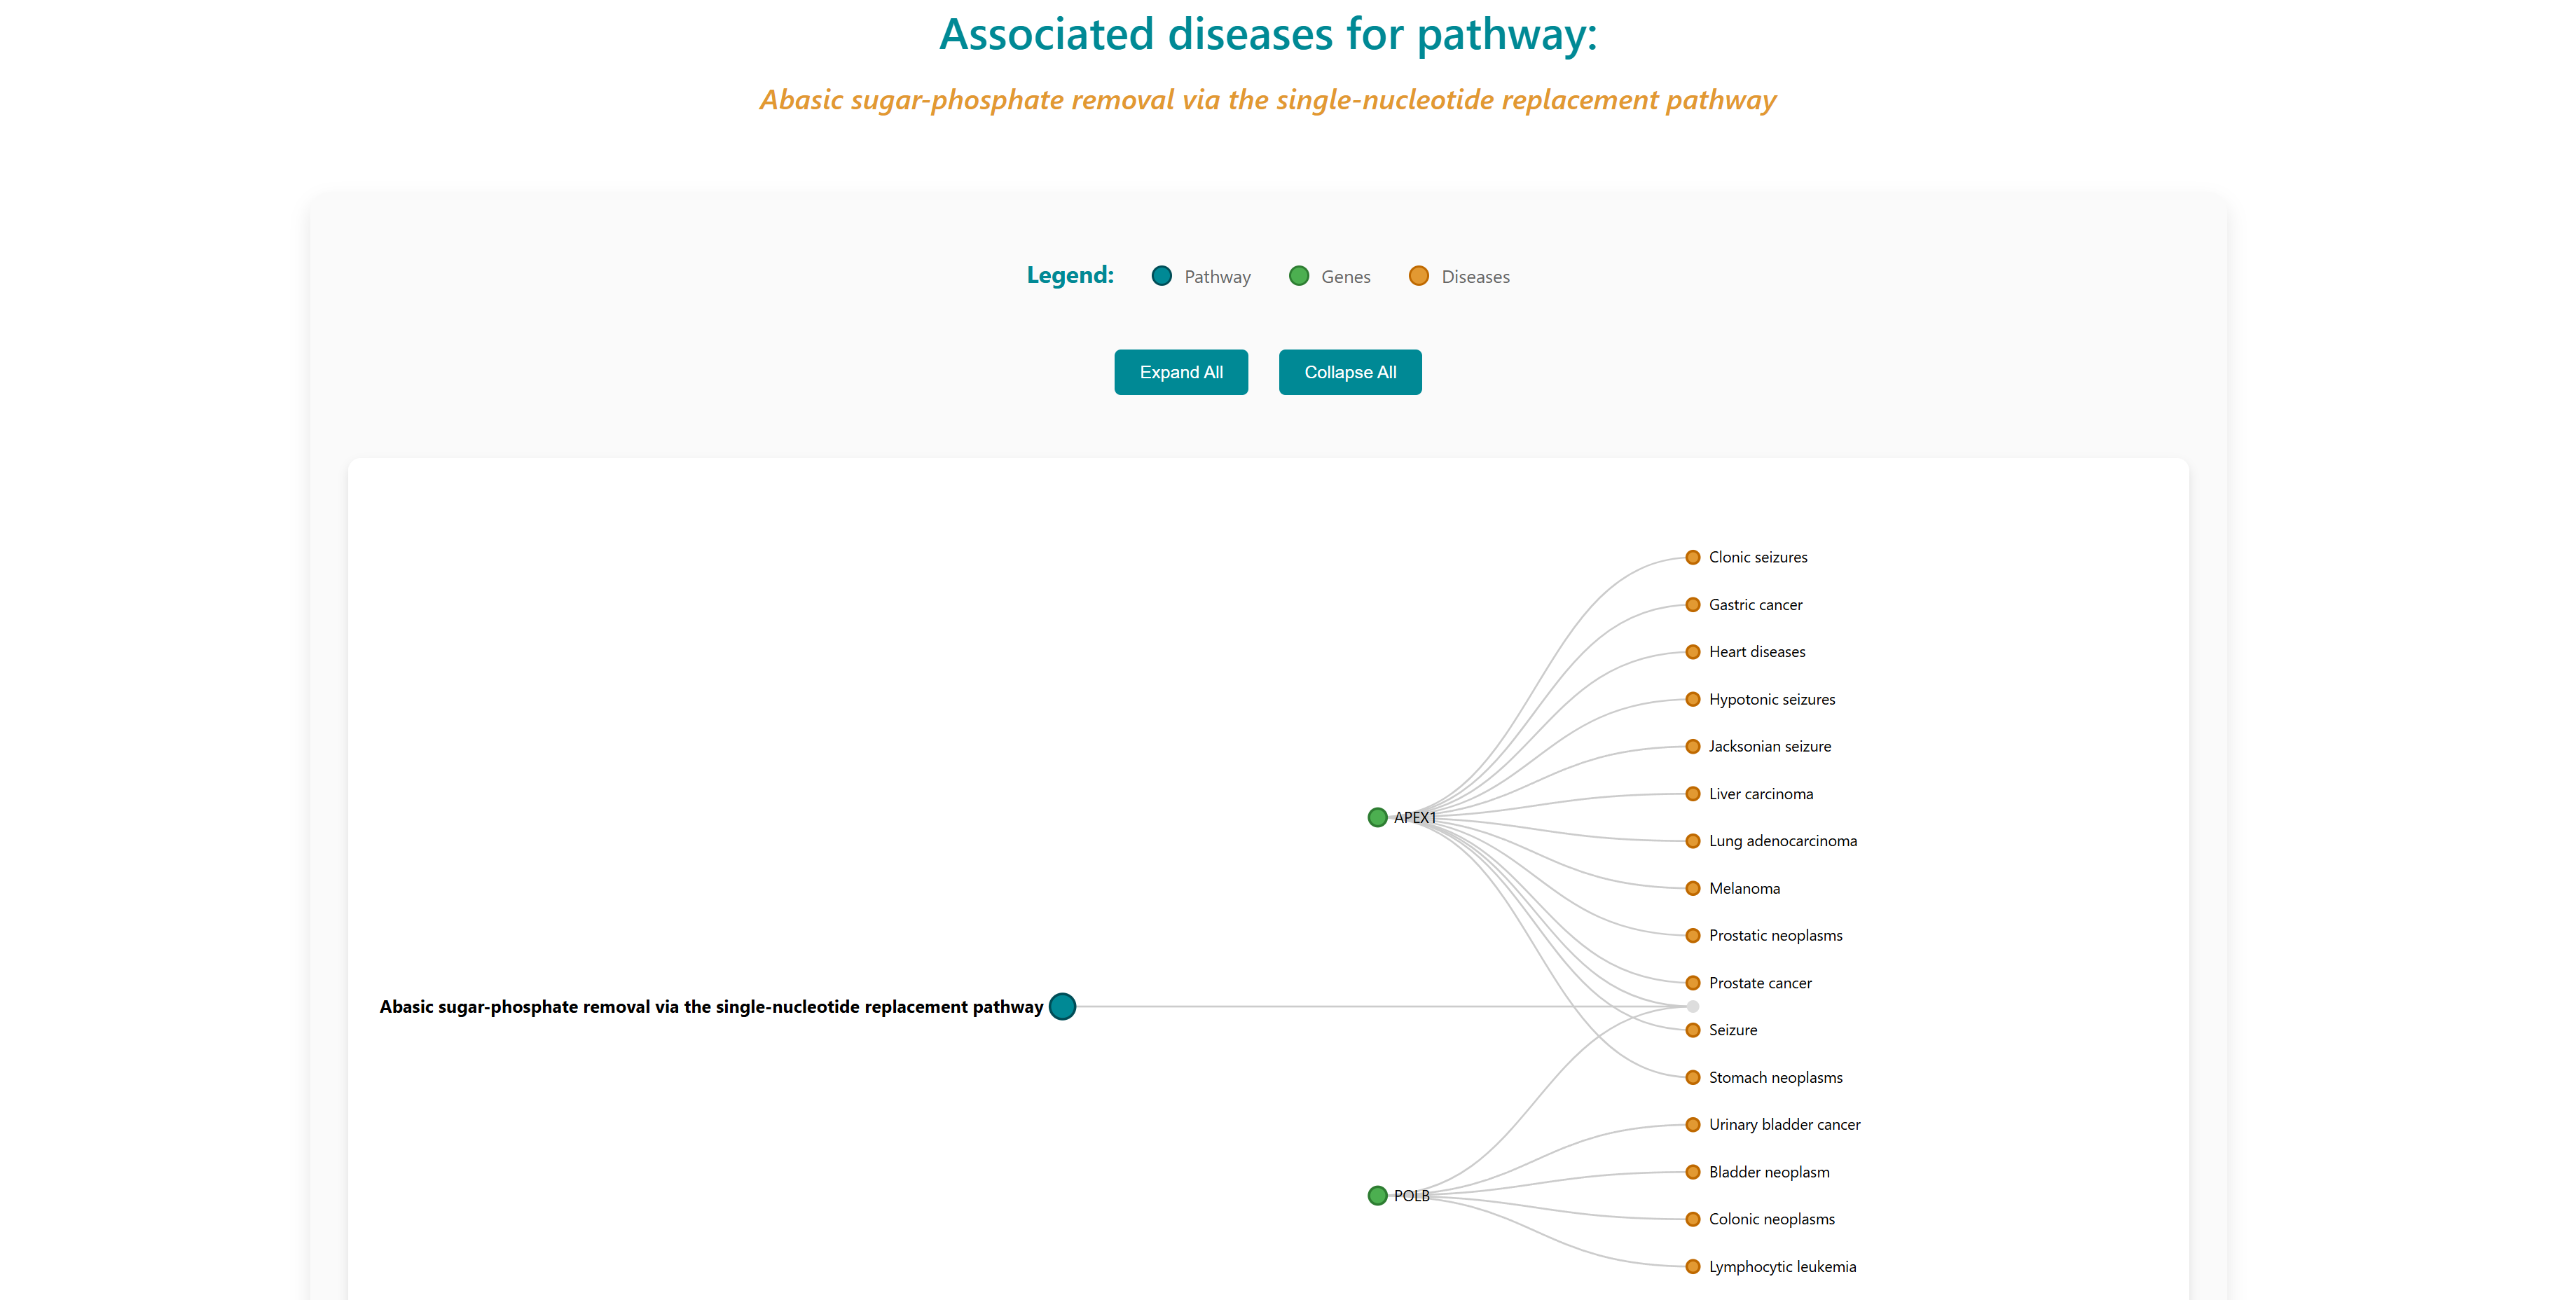
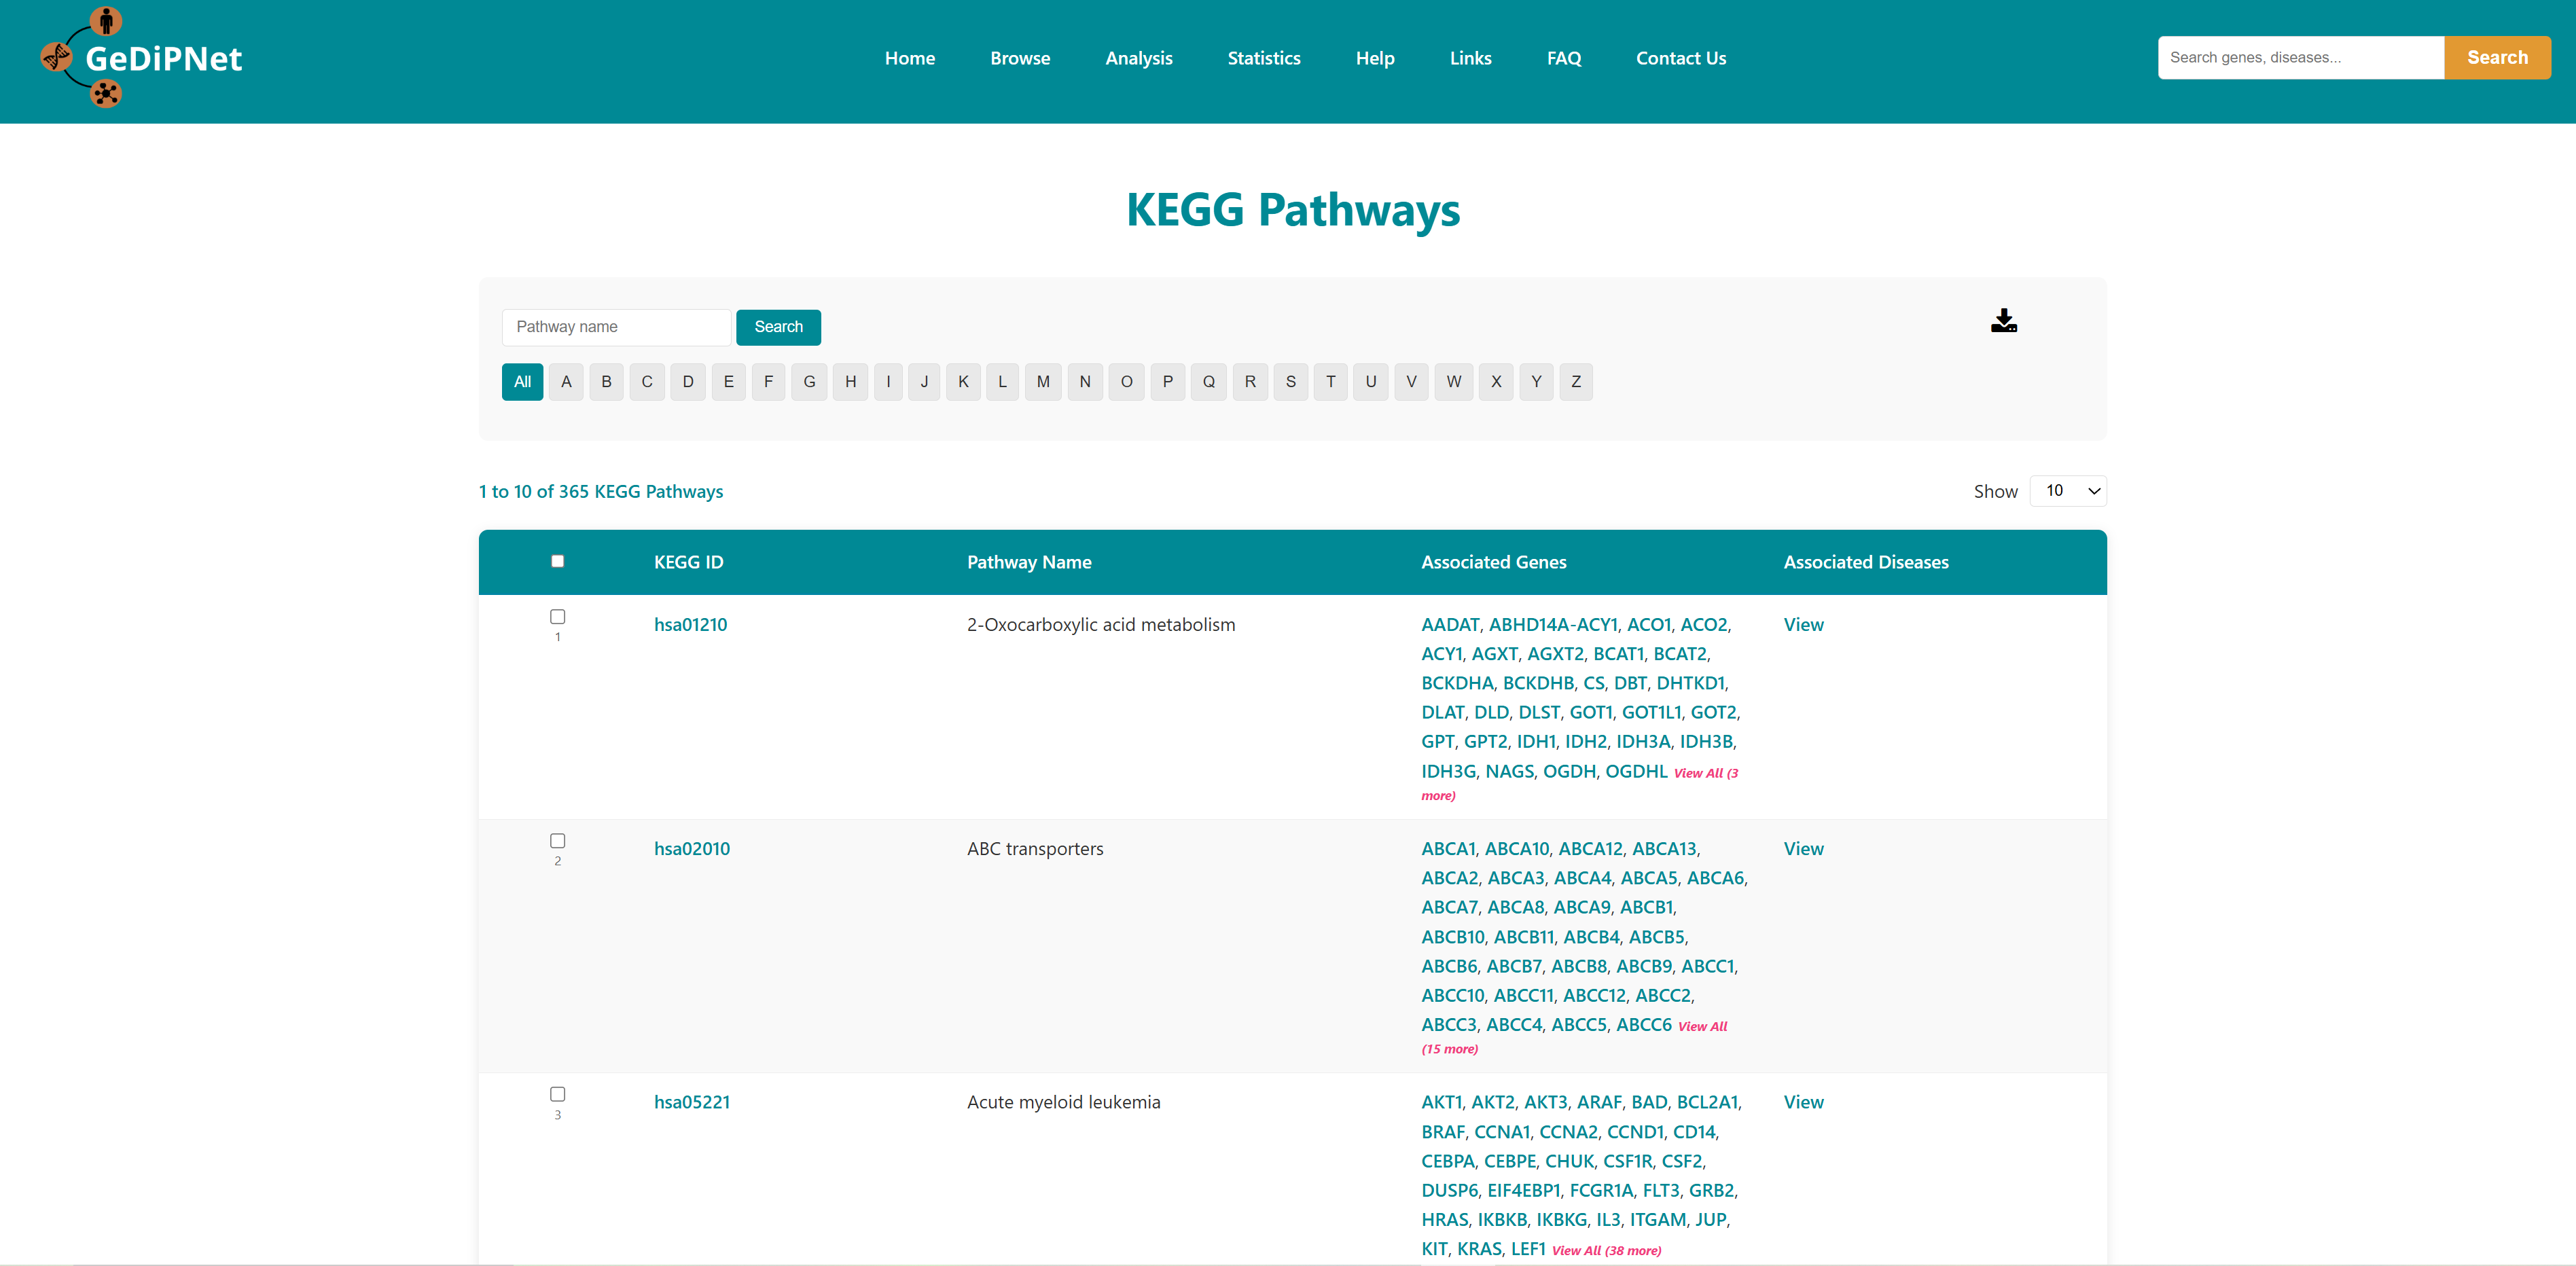
Reactome pathways and KEGG pages contains pathways associated with genes in the database. Each record is hyperlinked to a complete information page which also includes links to the Reactome and KEGG pathway database. Using the "View" option users can visualize the genes and diseases associated with the pathway. Users can download the entire table dataset or export only specifically chosen pathways entries, with all data available in TSV (Tab-Separated Values) format using the download button on top right in the control section.
2.3.1 Reactome
2.3.2 KEGG
3. Analysis
There are four different analysis that can be performed using GeDiPNet for deep biological insights.
3.1 Enrichment Analysis
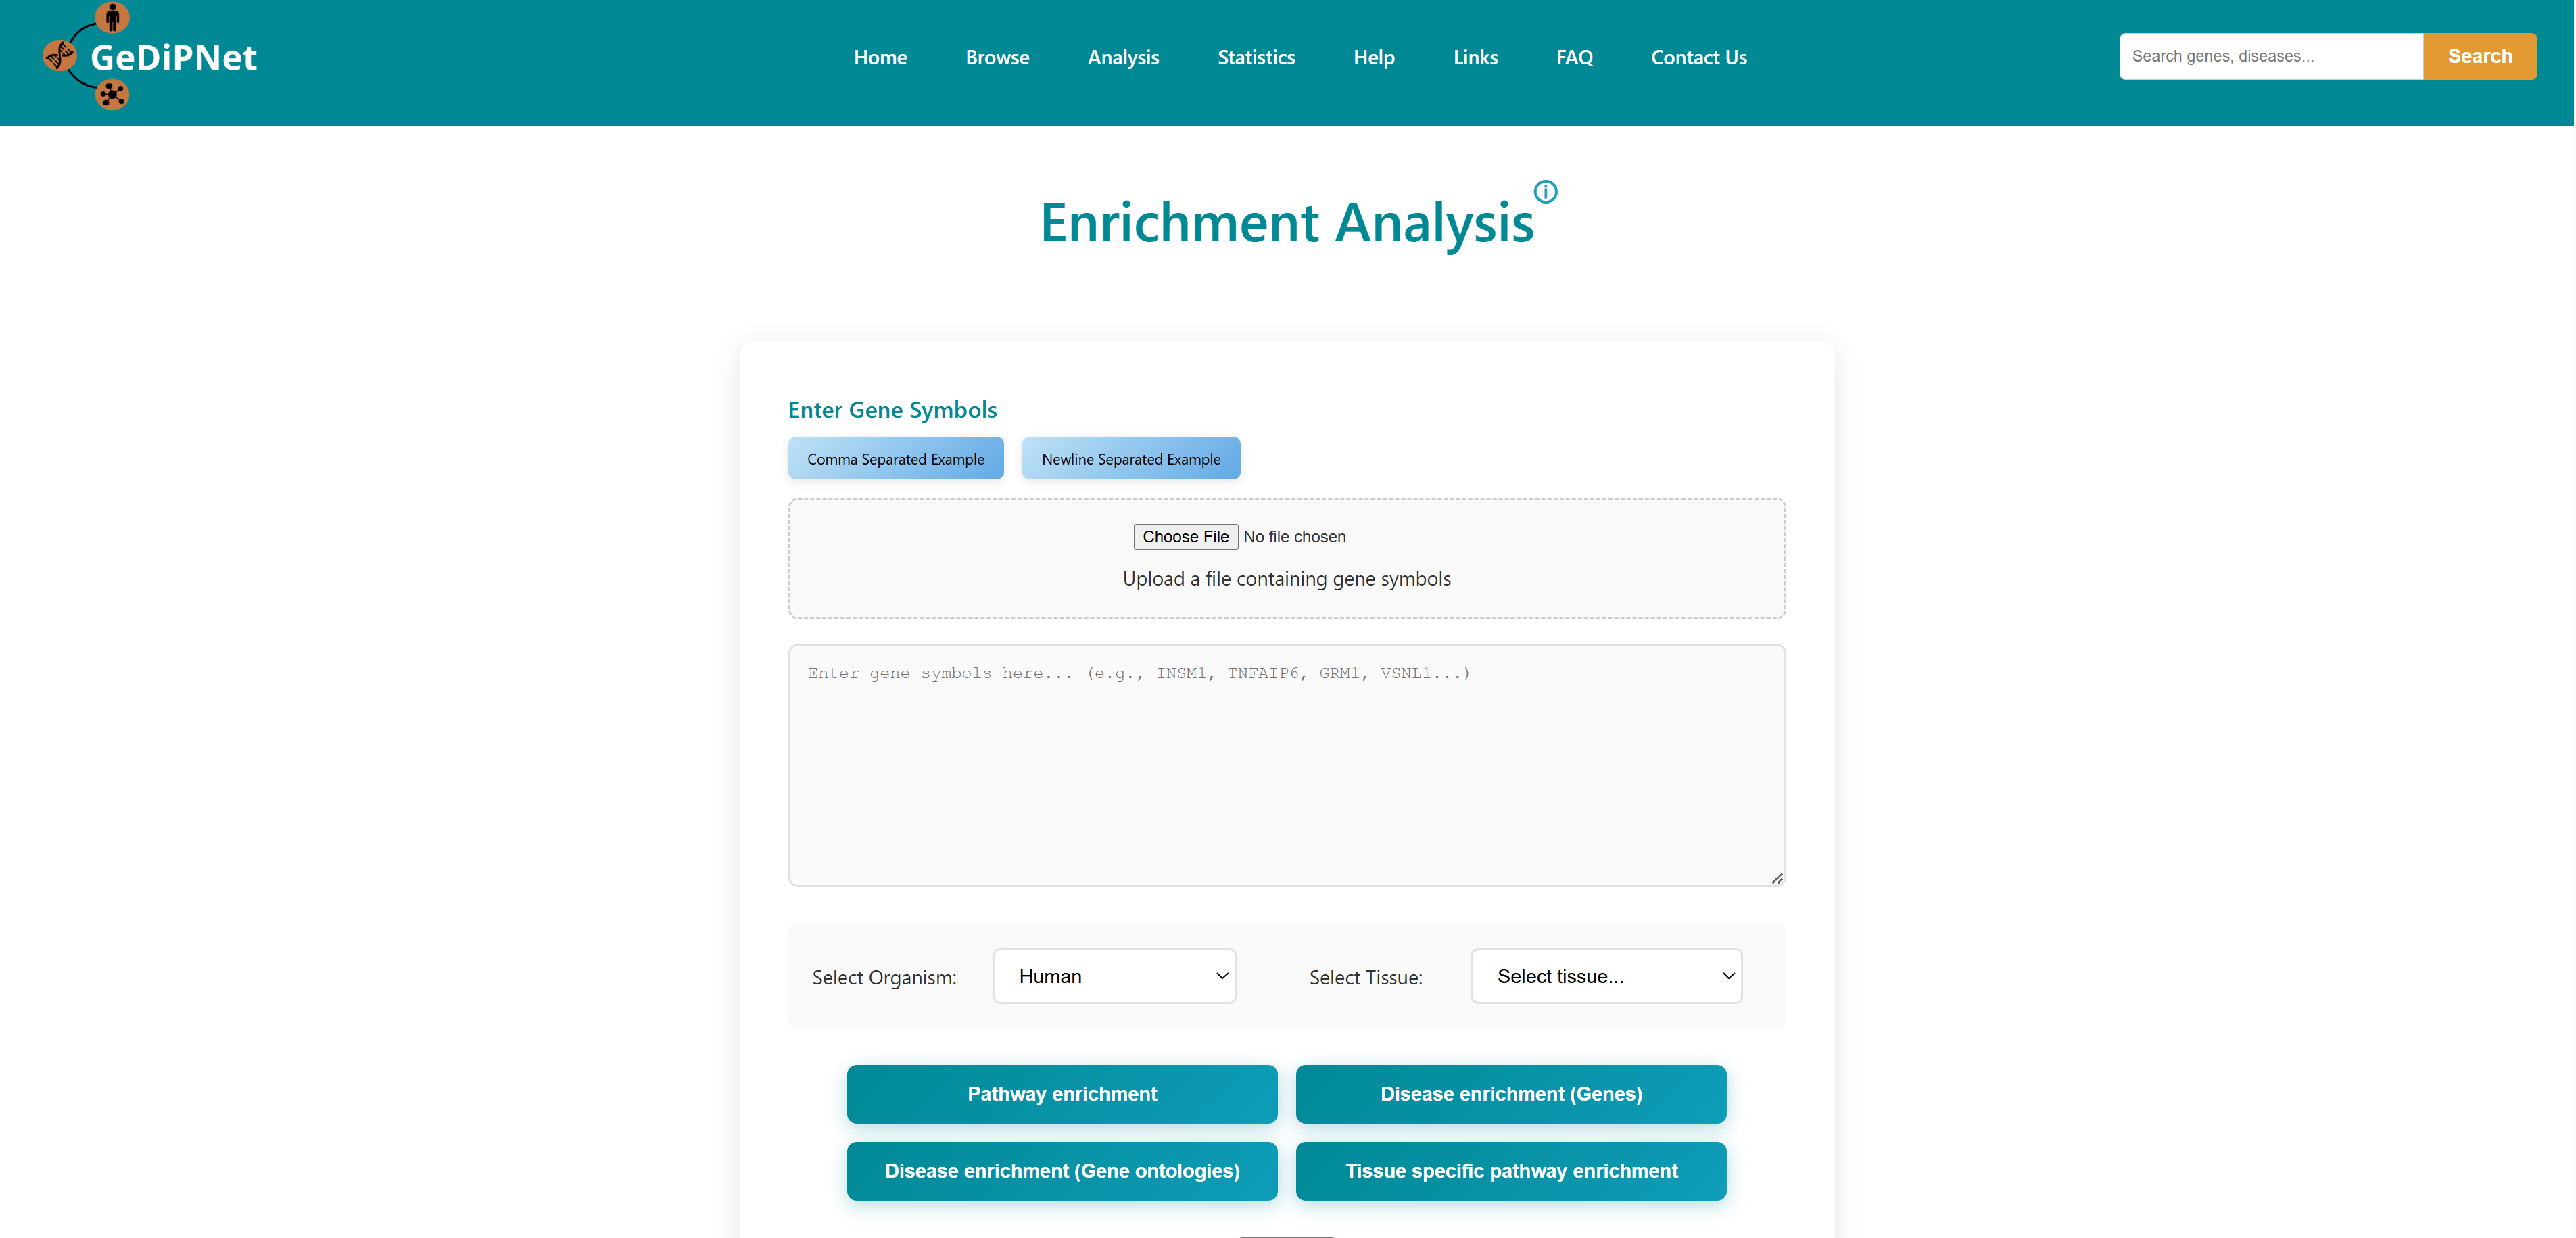
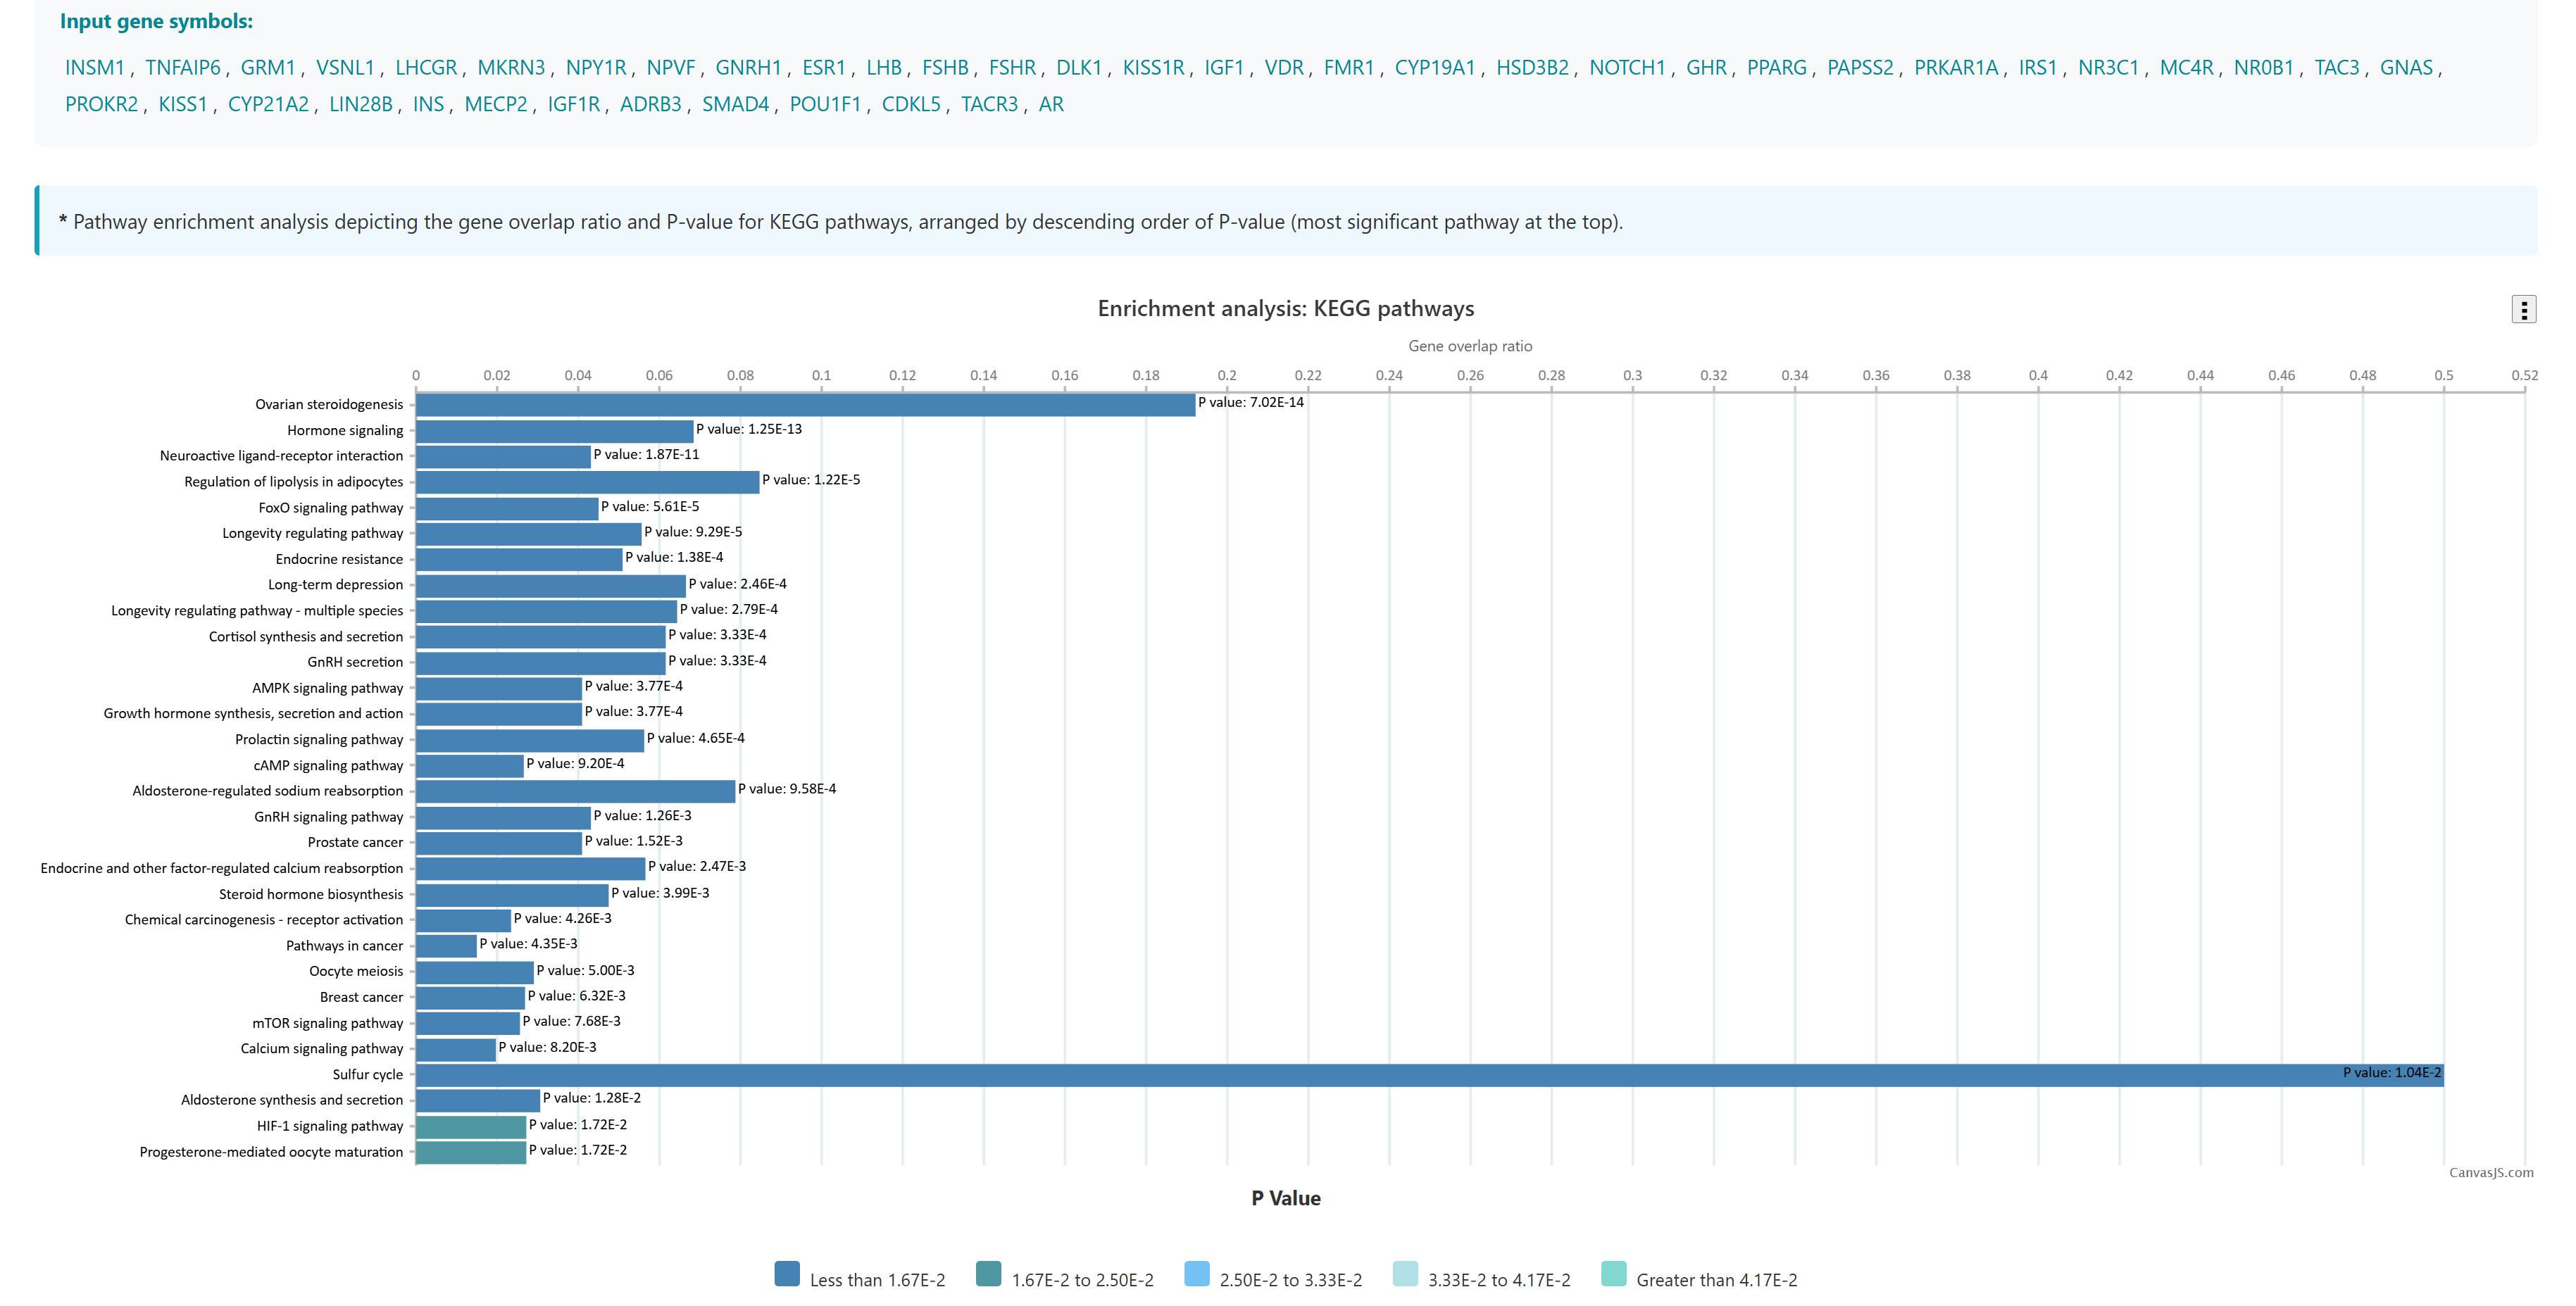
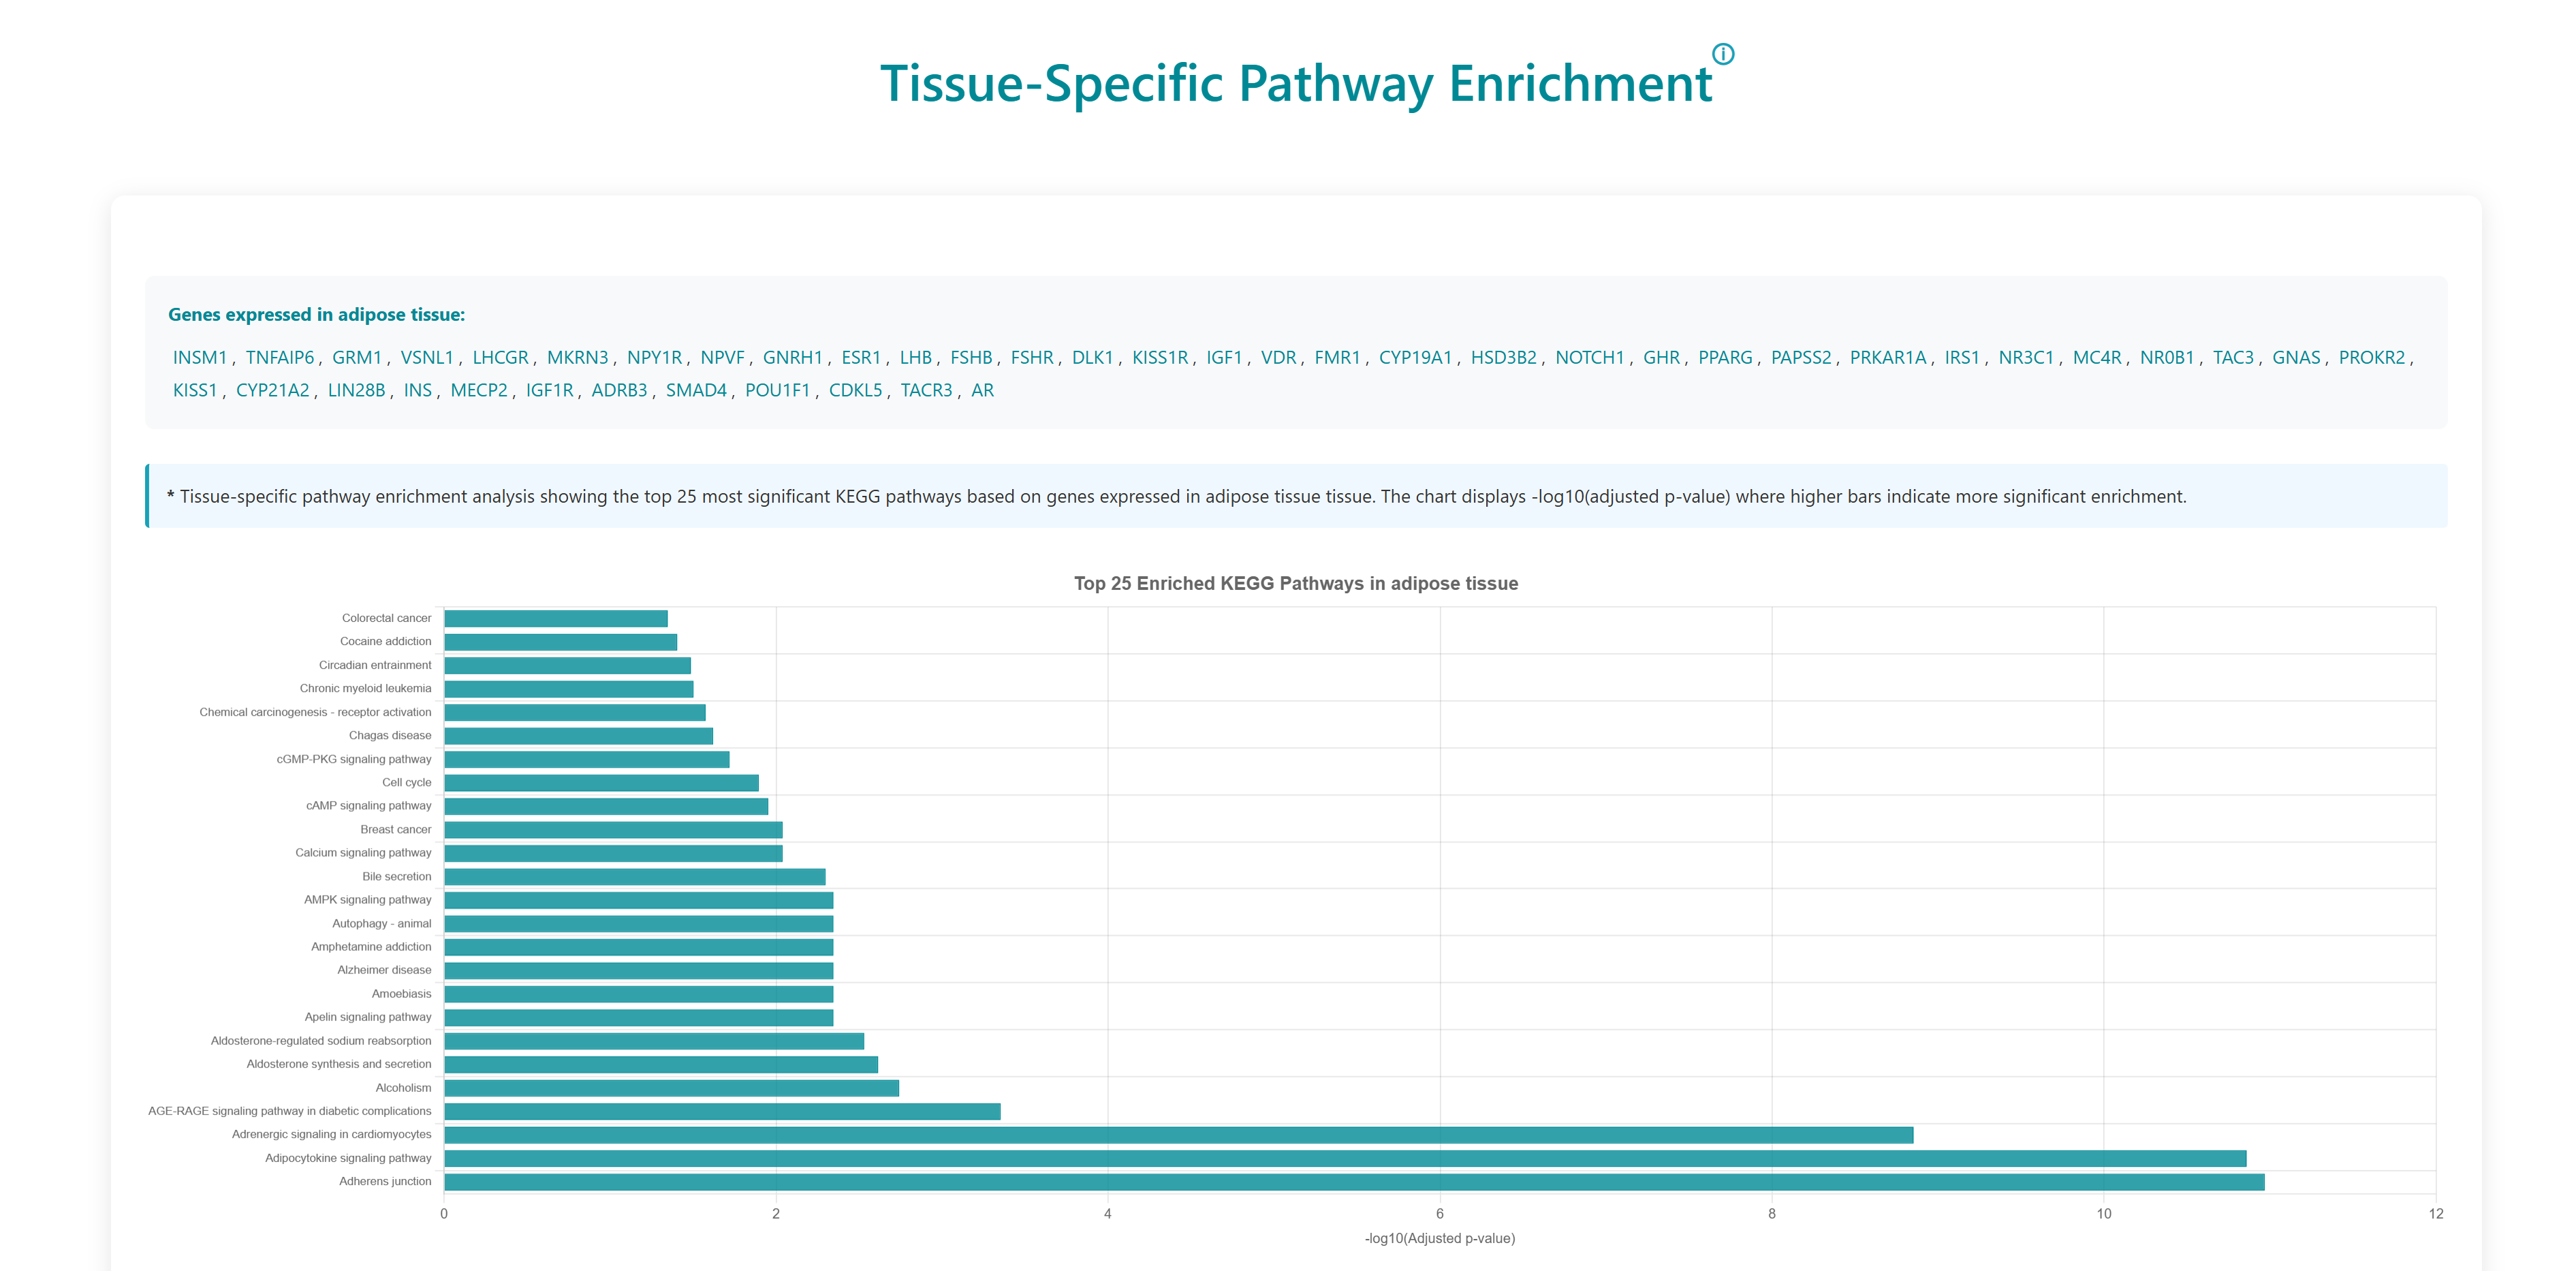
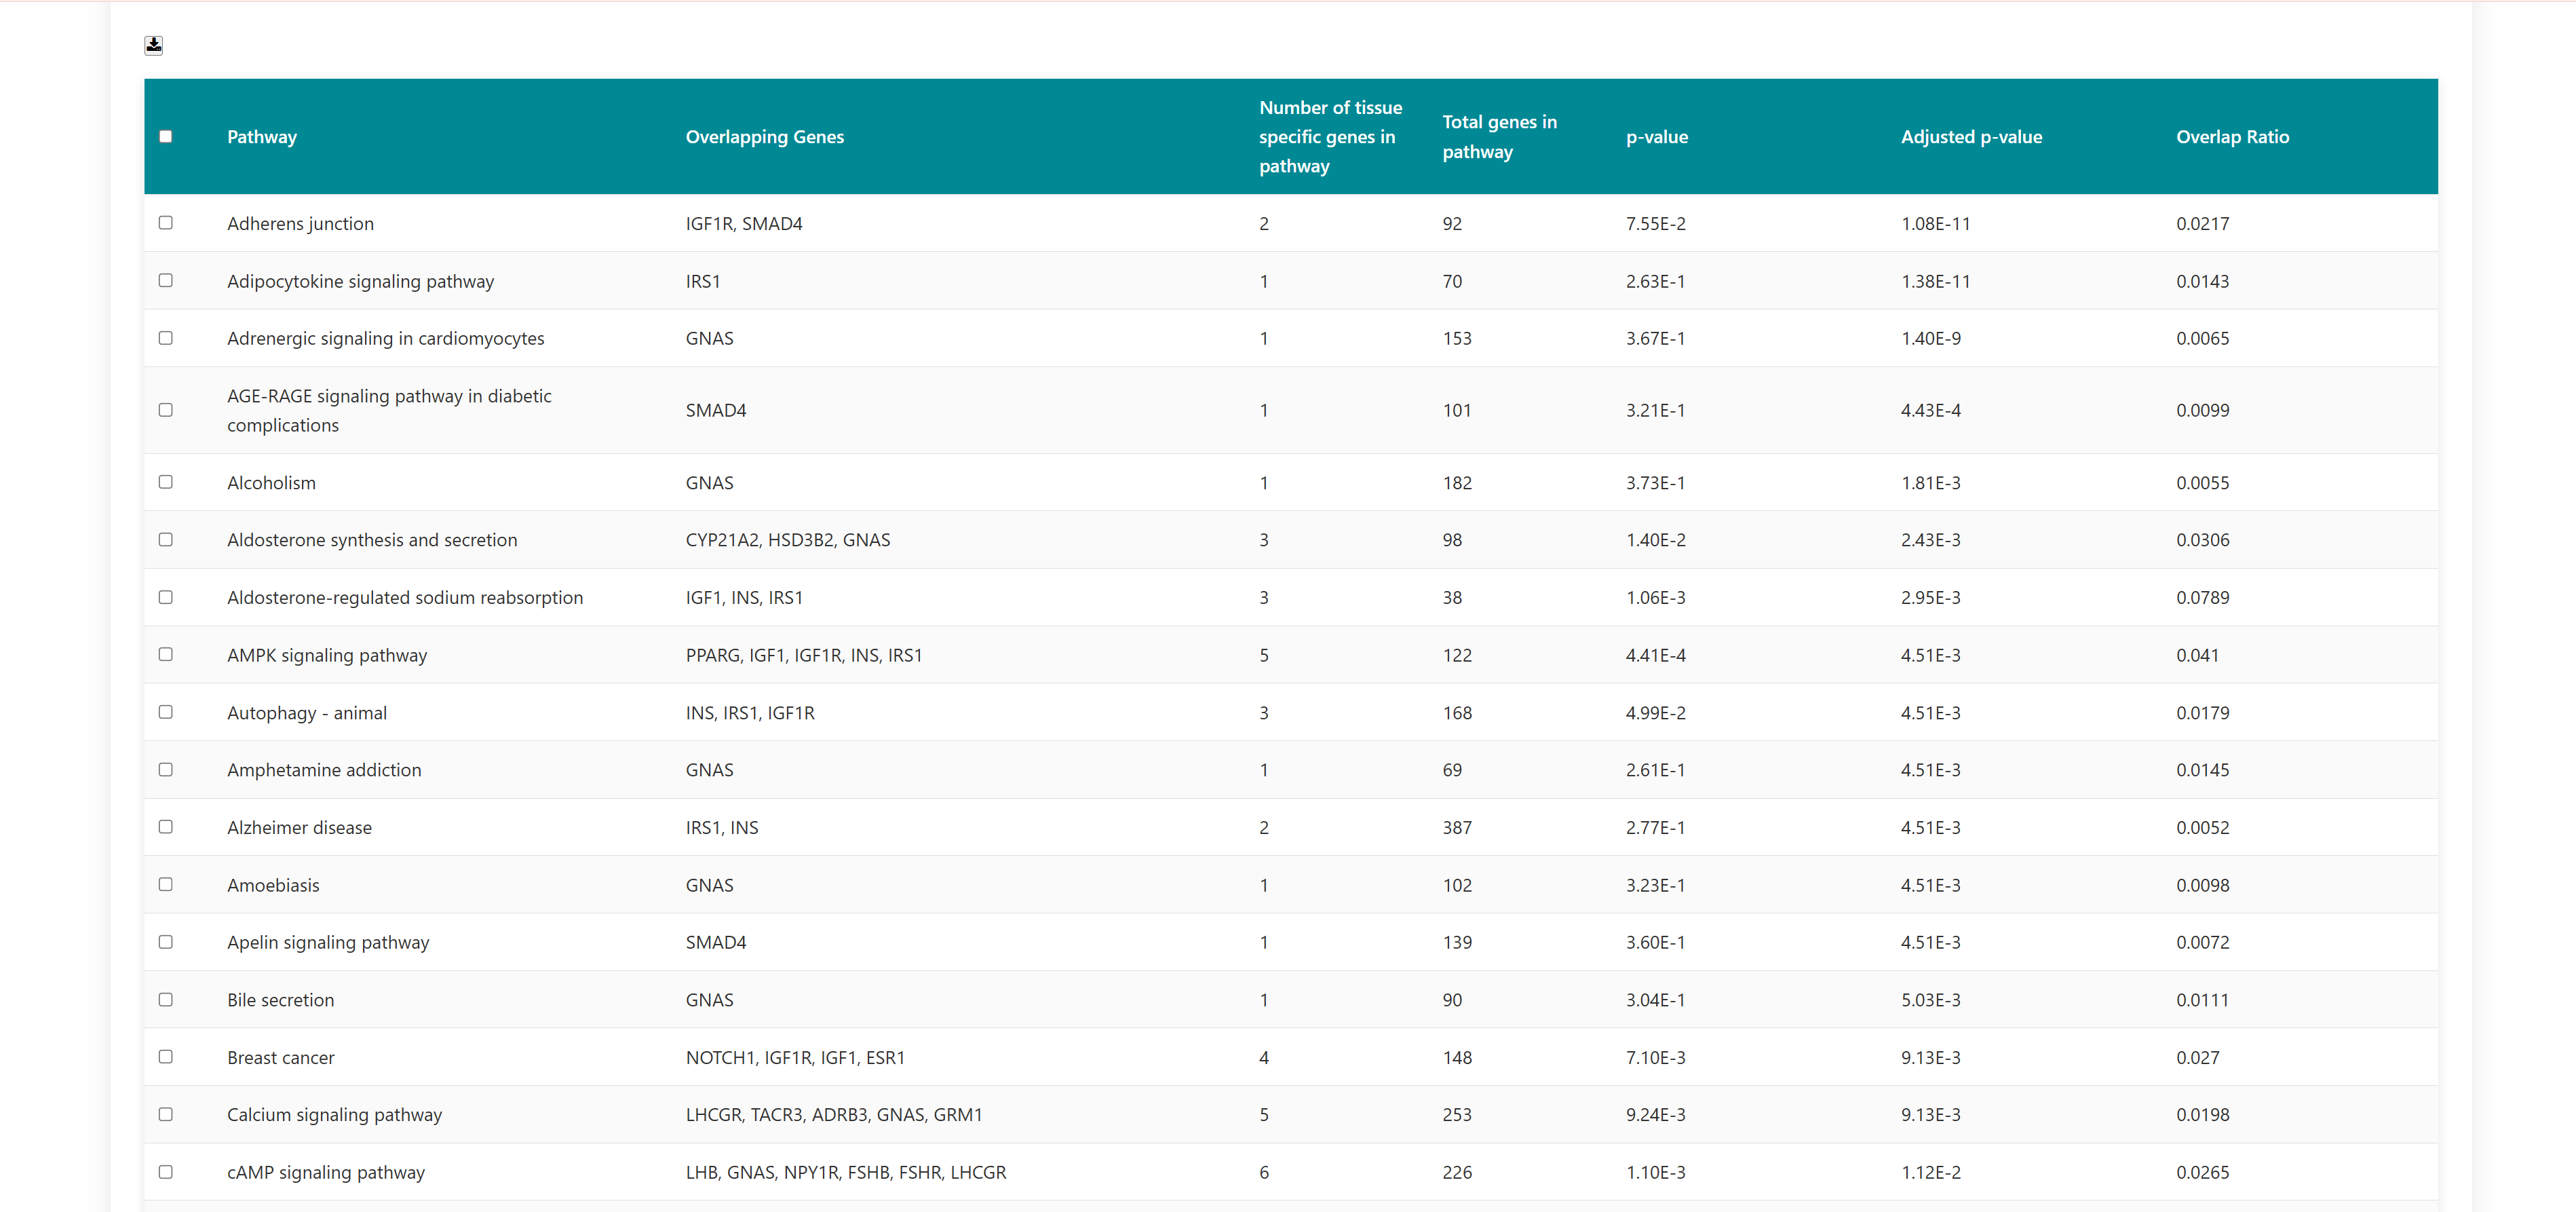
Using this tool, user can enter or upload a gene list, which can be used to perform pathway enrichment analyses, disease enrichment analyses, tissue specific pathway enrichment. The gene list can be a comma separated or new line separated. Pathway enrichment, disease enrichment or tissue specific pathway enrichment can be performed using the respective buttons. You can select the organisms from the list below the query box where human, zebrafish, mouse and rat are available as options. For tissue specific pathway enrichment, the user needs to select tissue of interest.
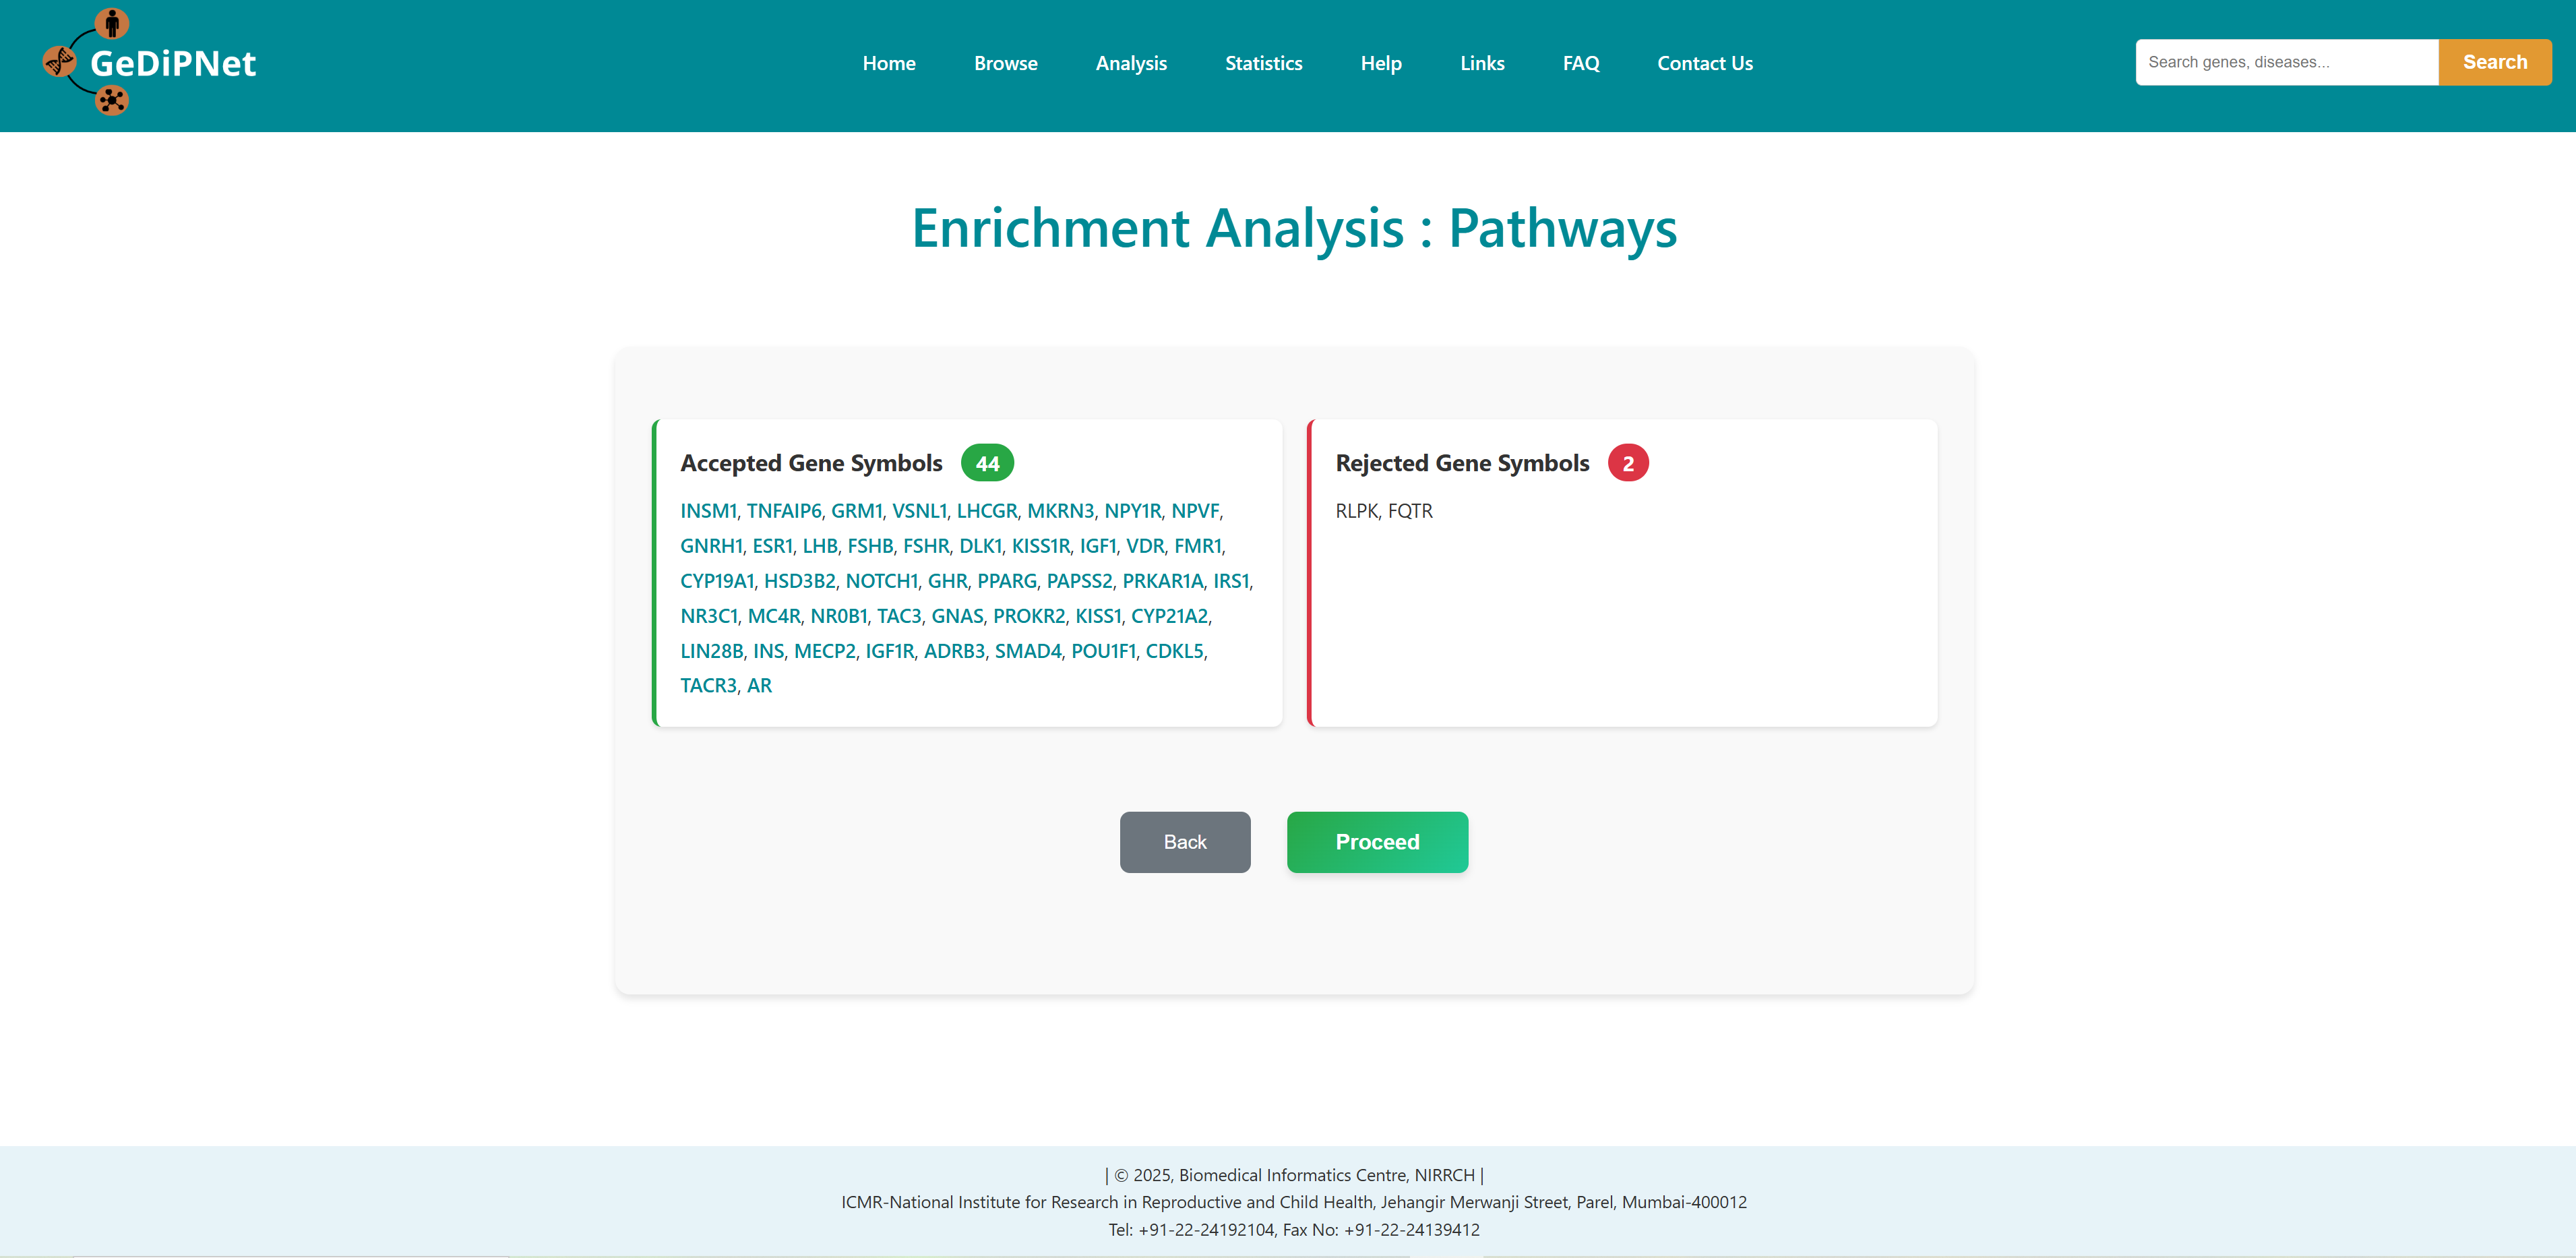
All correct and incorrect entries will be displayed as accepted and rejected gene symbols on the webpage as soon as the gene set is submitted for analysis. Users can either proceed with their analysis or return to previous page.
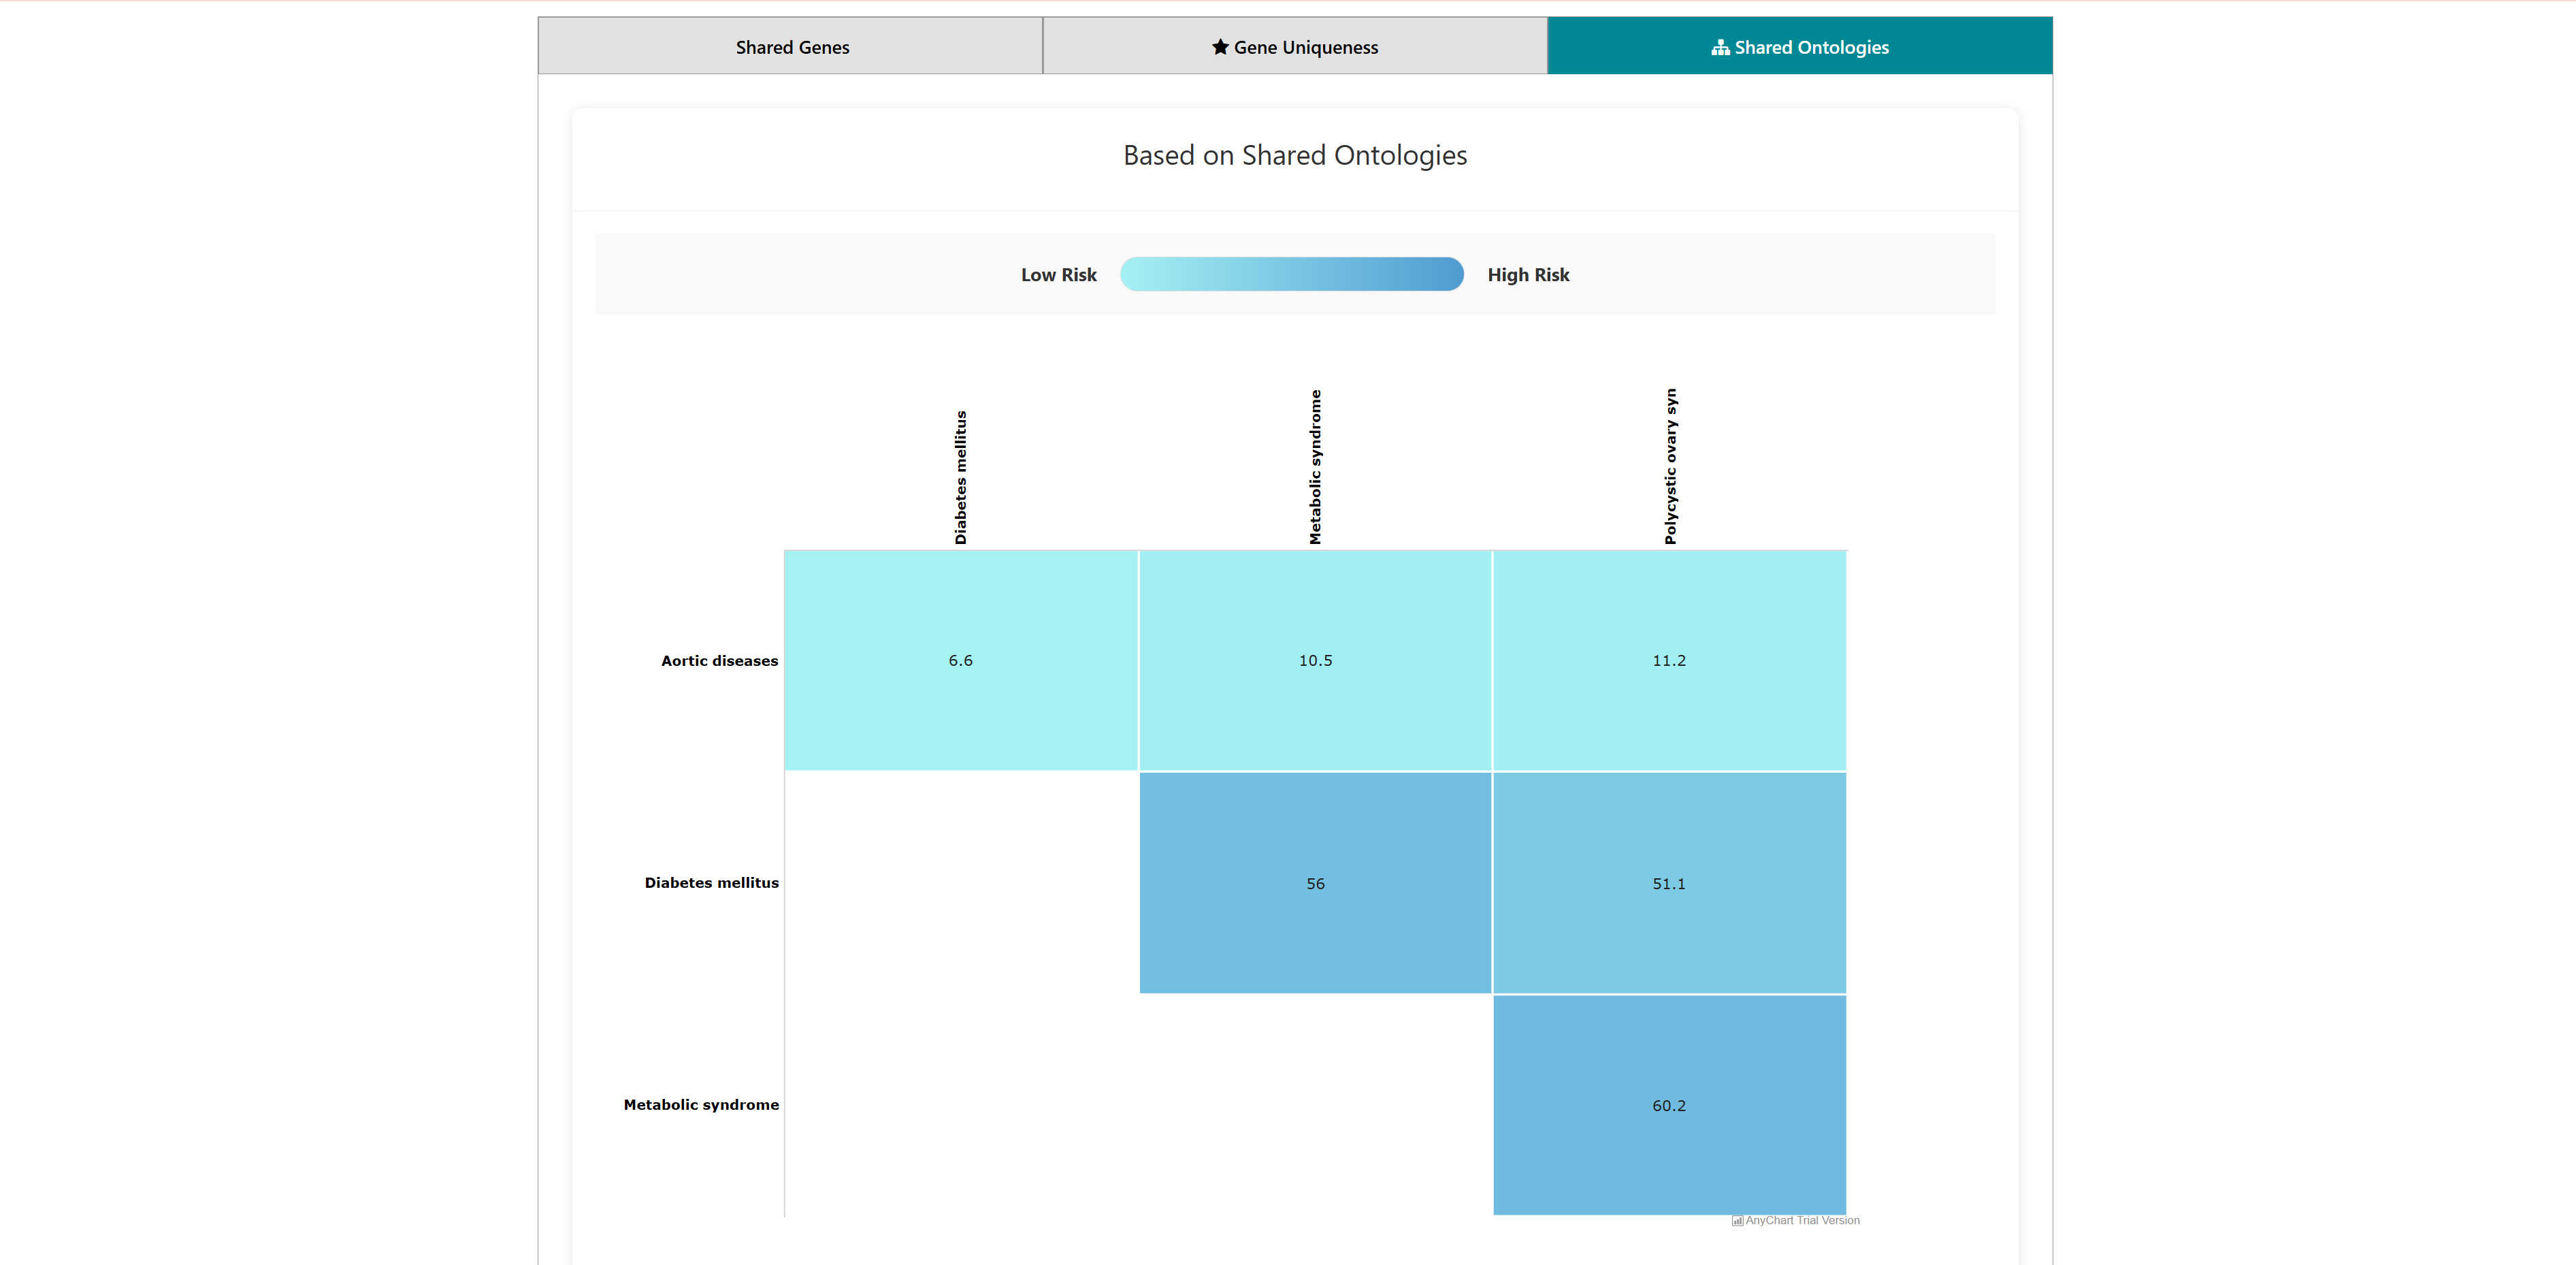
3.2 Comorbidity Analysis
This tool can be used to predict comorbidity based on shared genes and their ontologies, uniqueness of shared genes, and network-based separation between them. For more details of the methodology refer to the research publication.
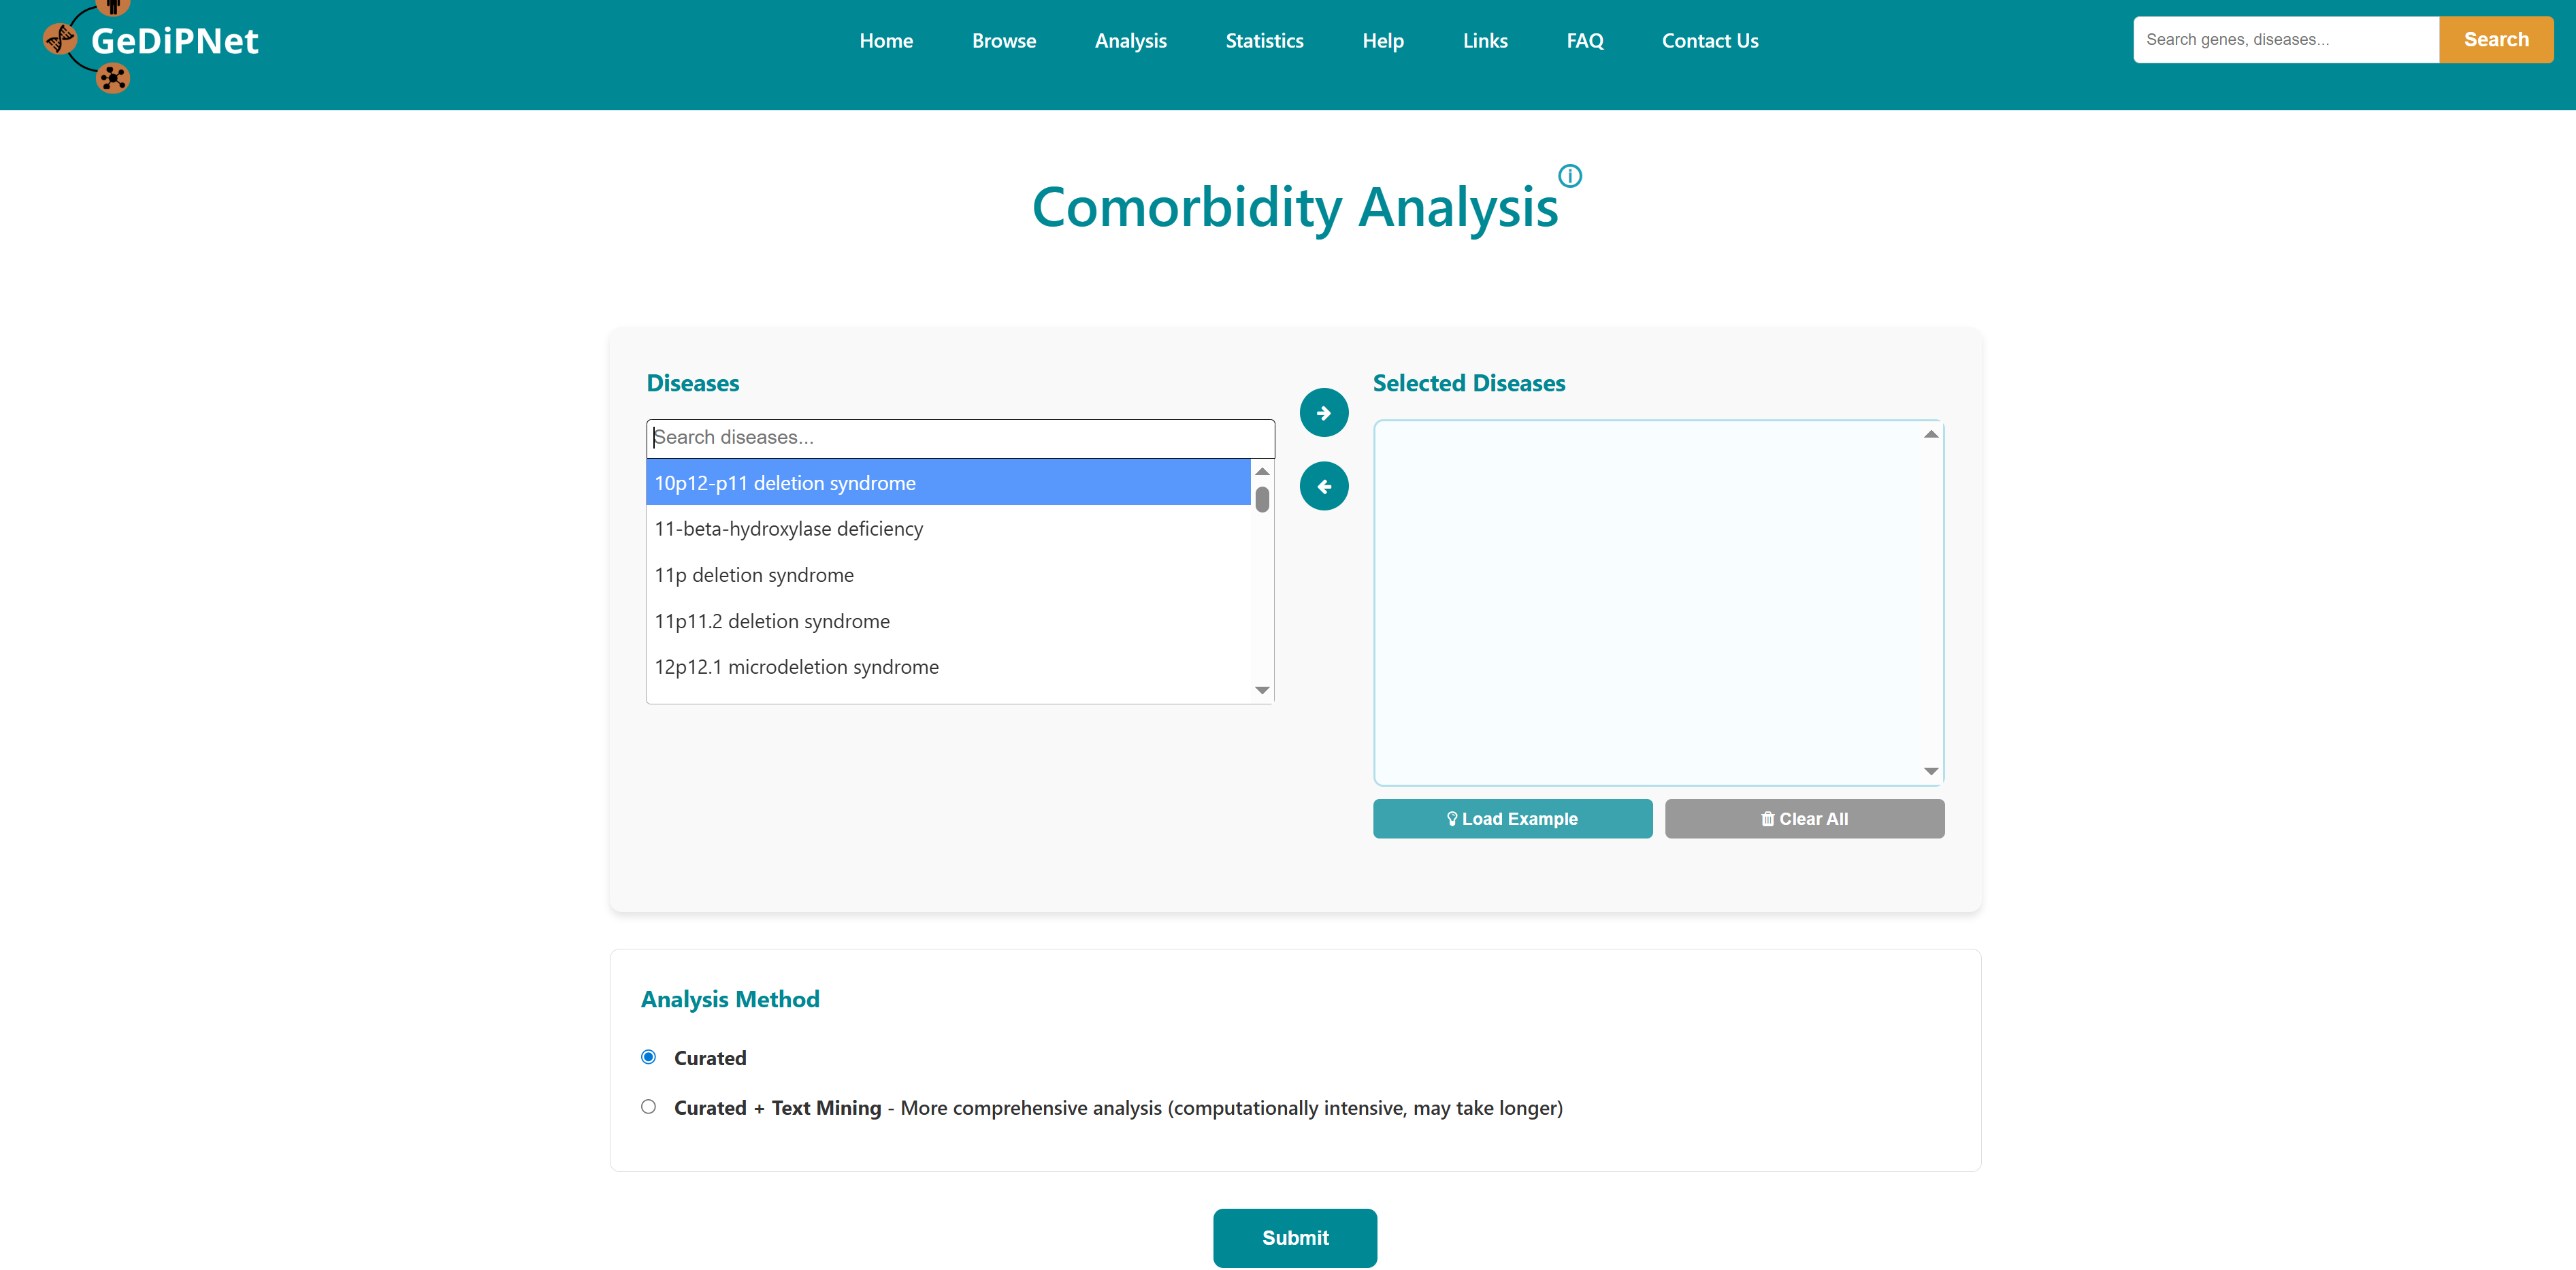
The home page of the tool has a list of diseases in the left column. User can select any number of disease names using the search with autofill option and use -> symbol to move the name in "selected diseases" column. Multiple diseases can be selected using "ctrl" key of the keyboard. An option to deselect diseases by using <- symbol is also provided. Users can select from either of the two datasets, "Curated" and "Curated + Text mining".
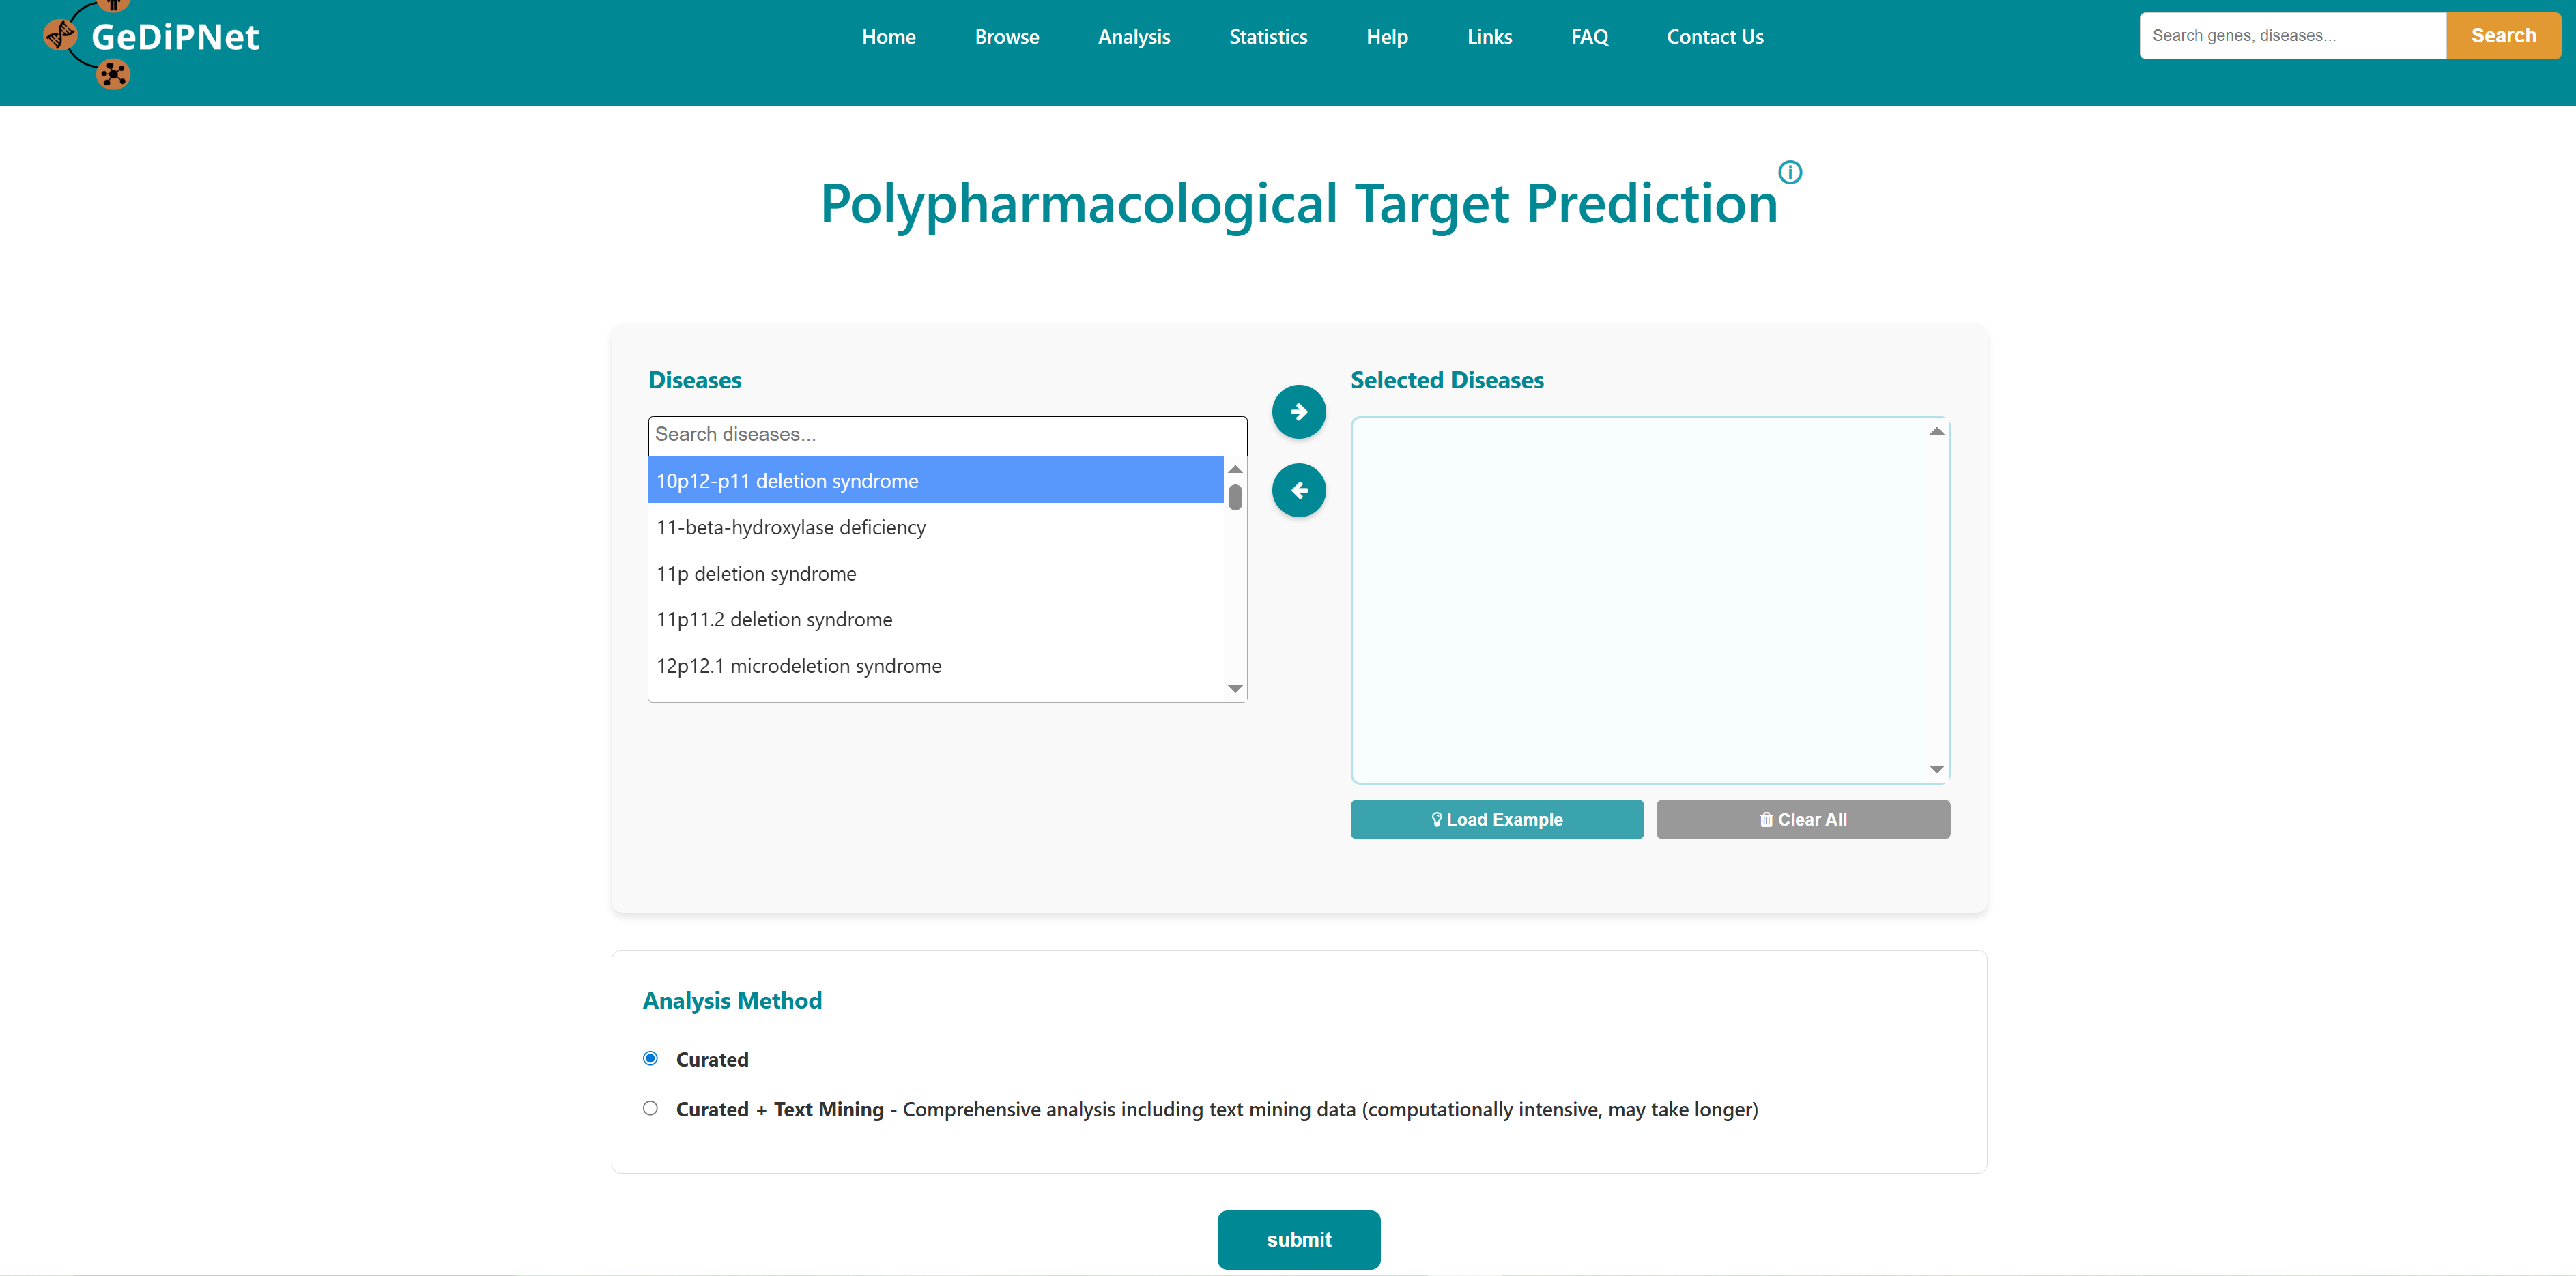
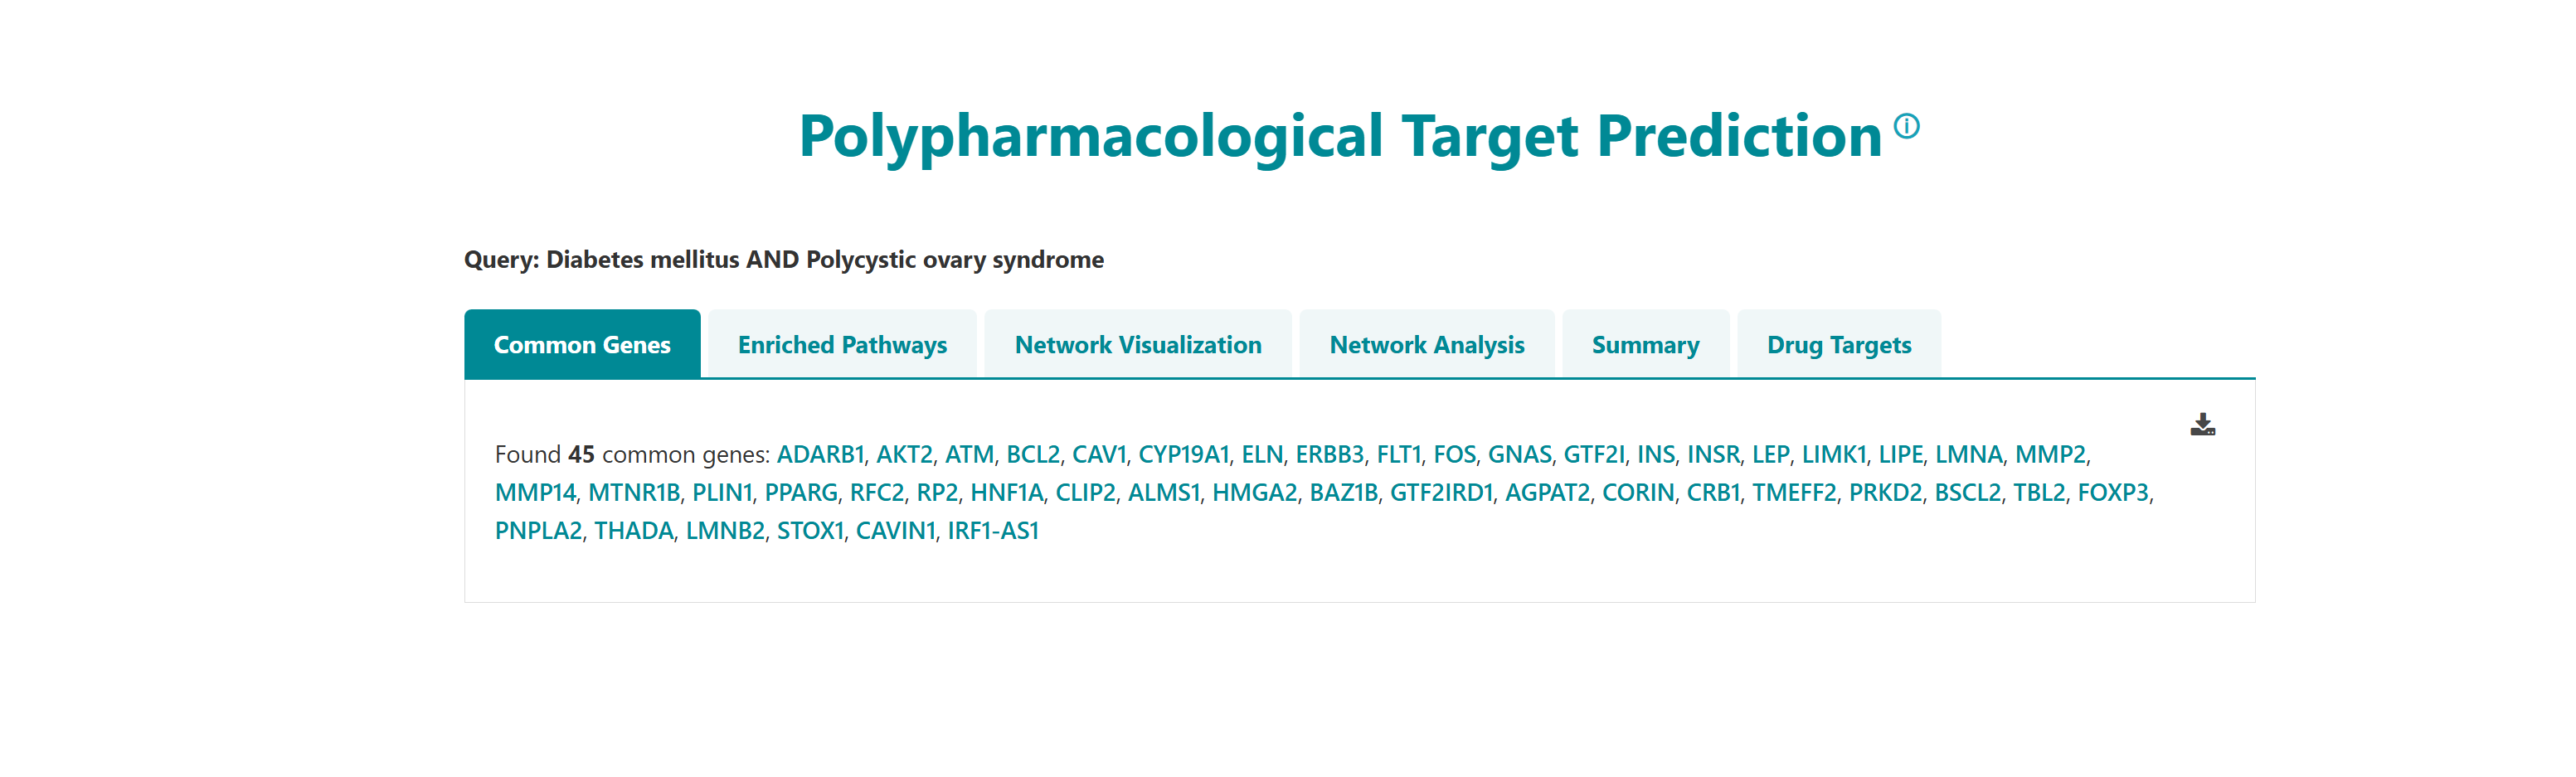
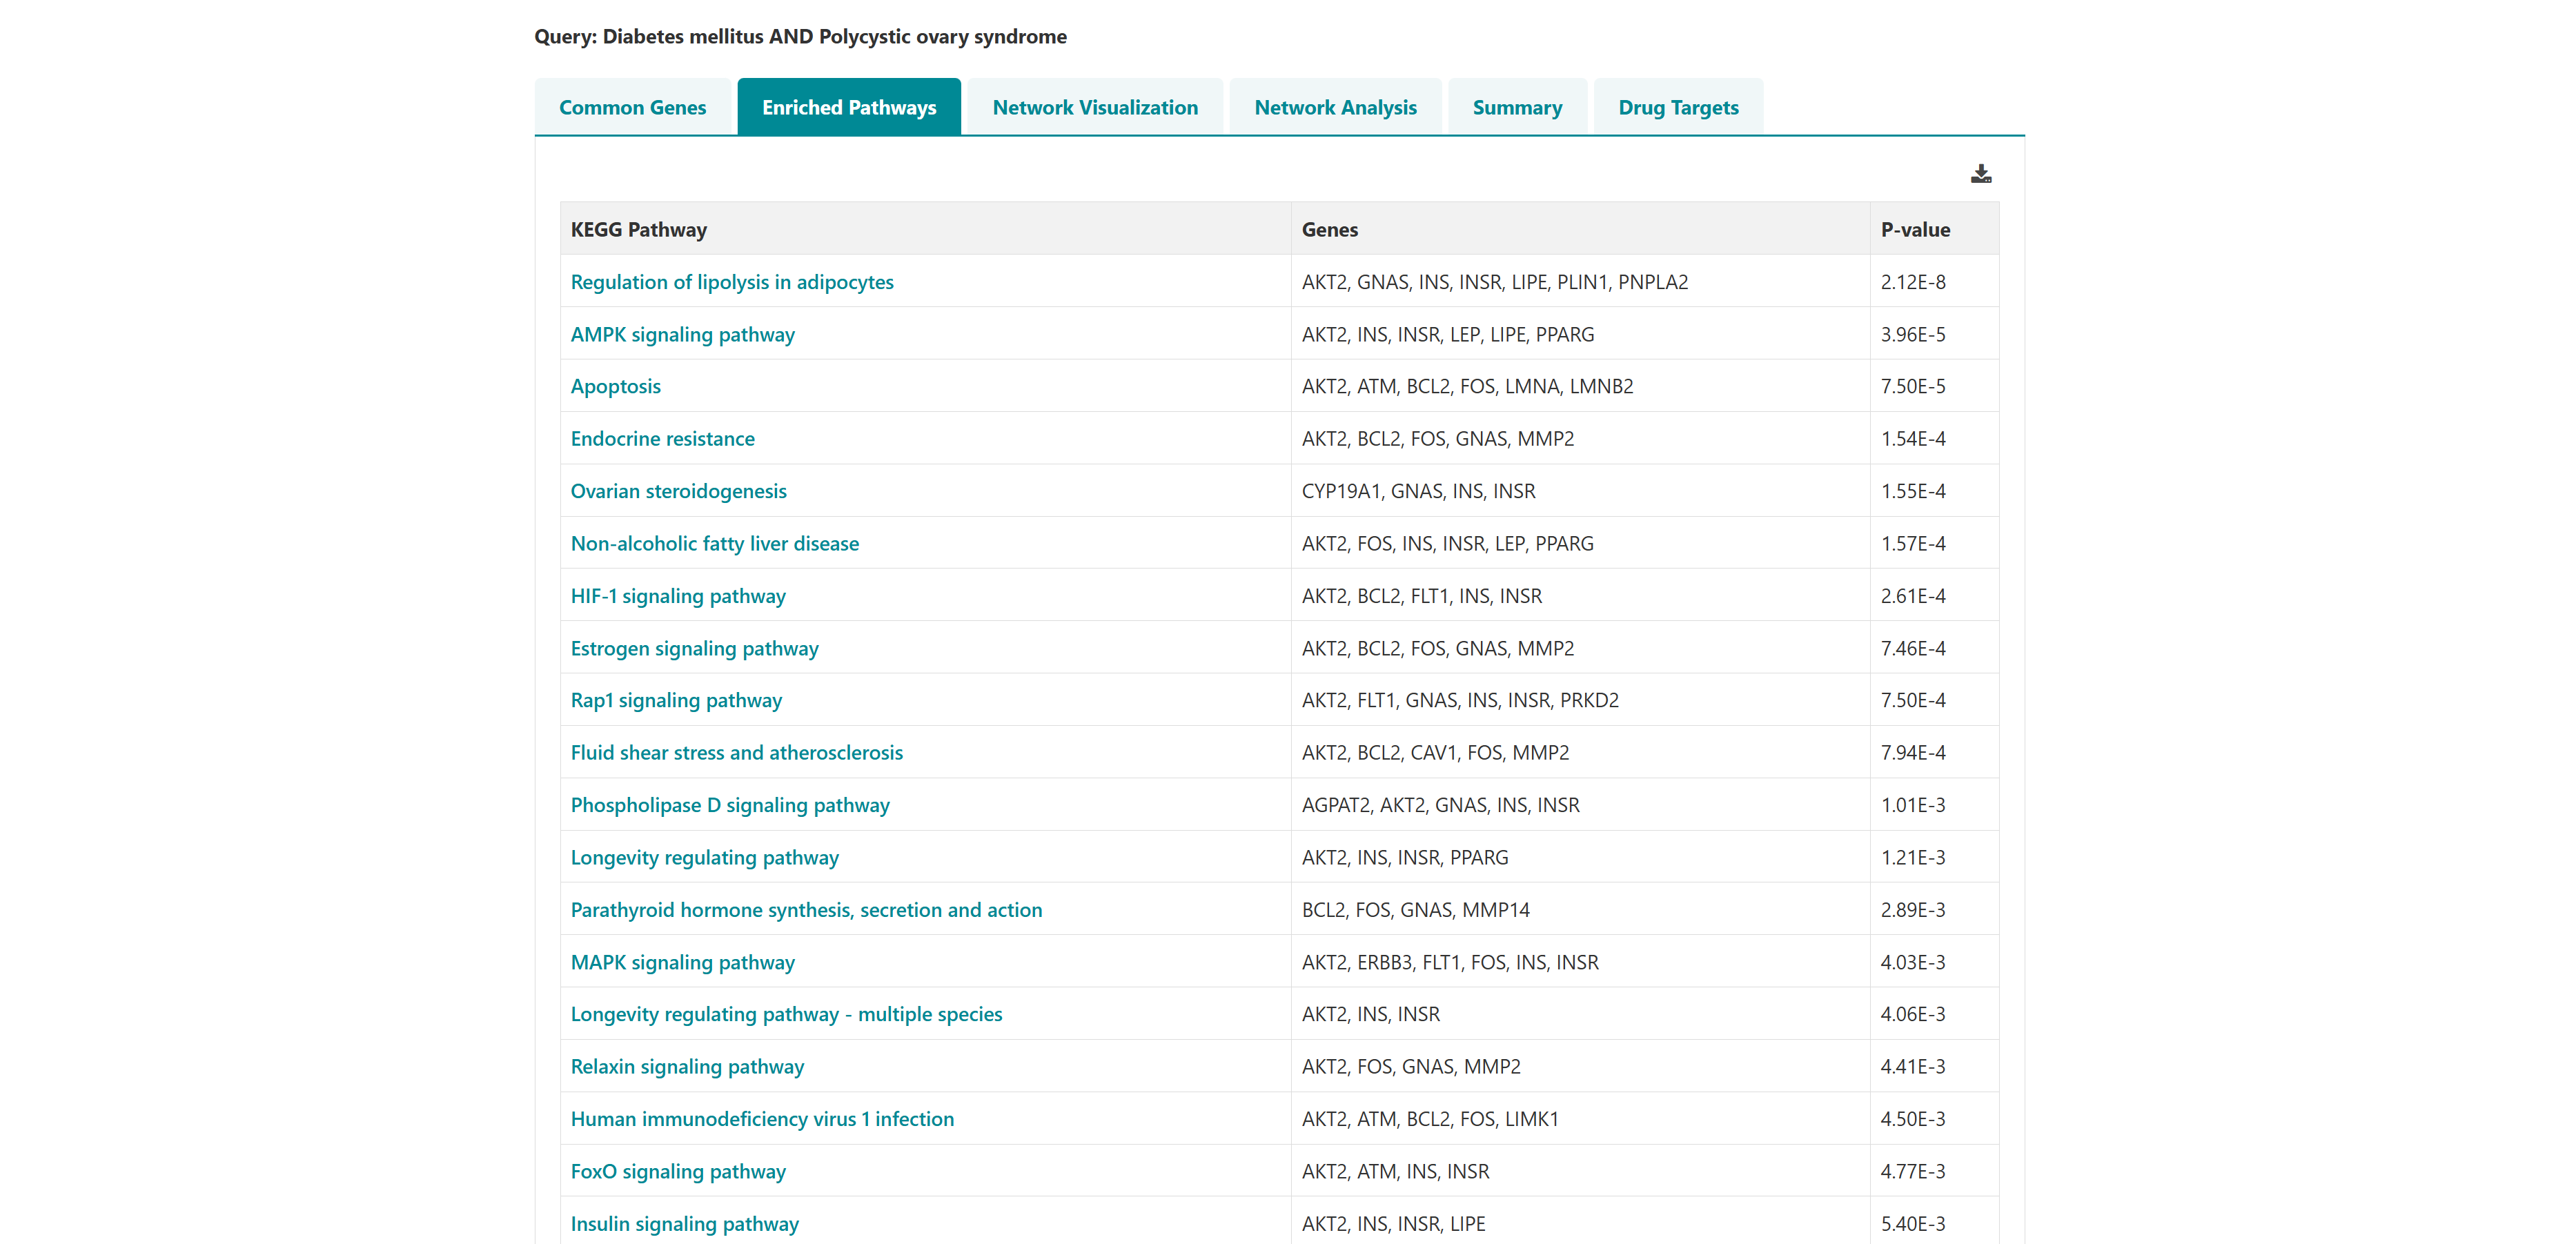
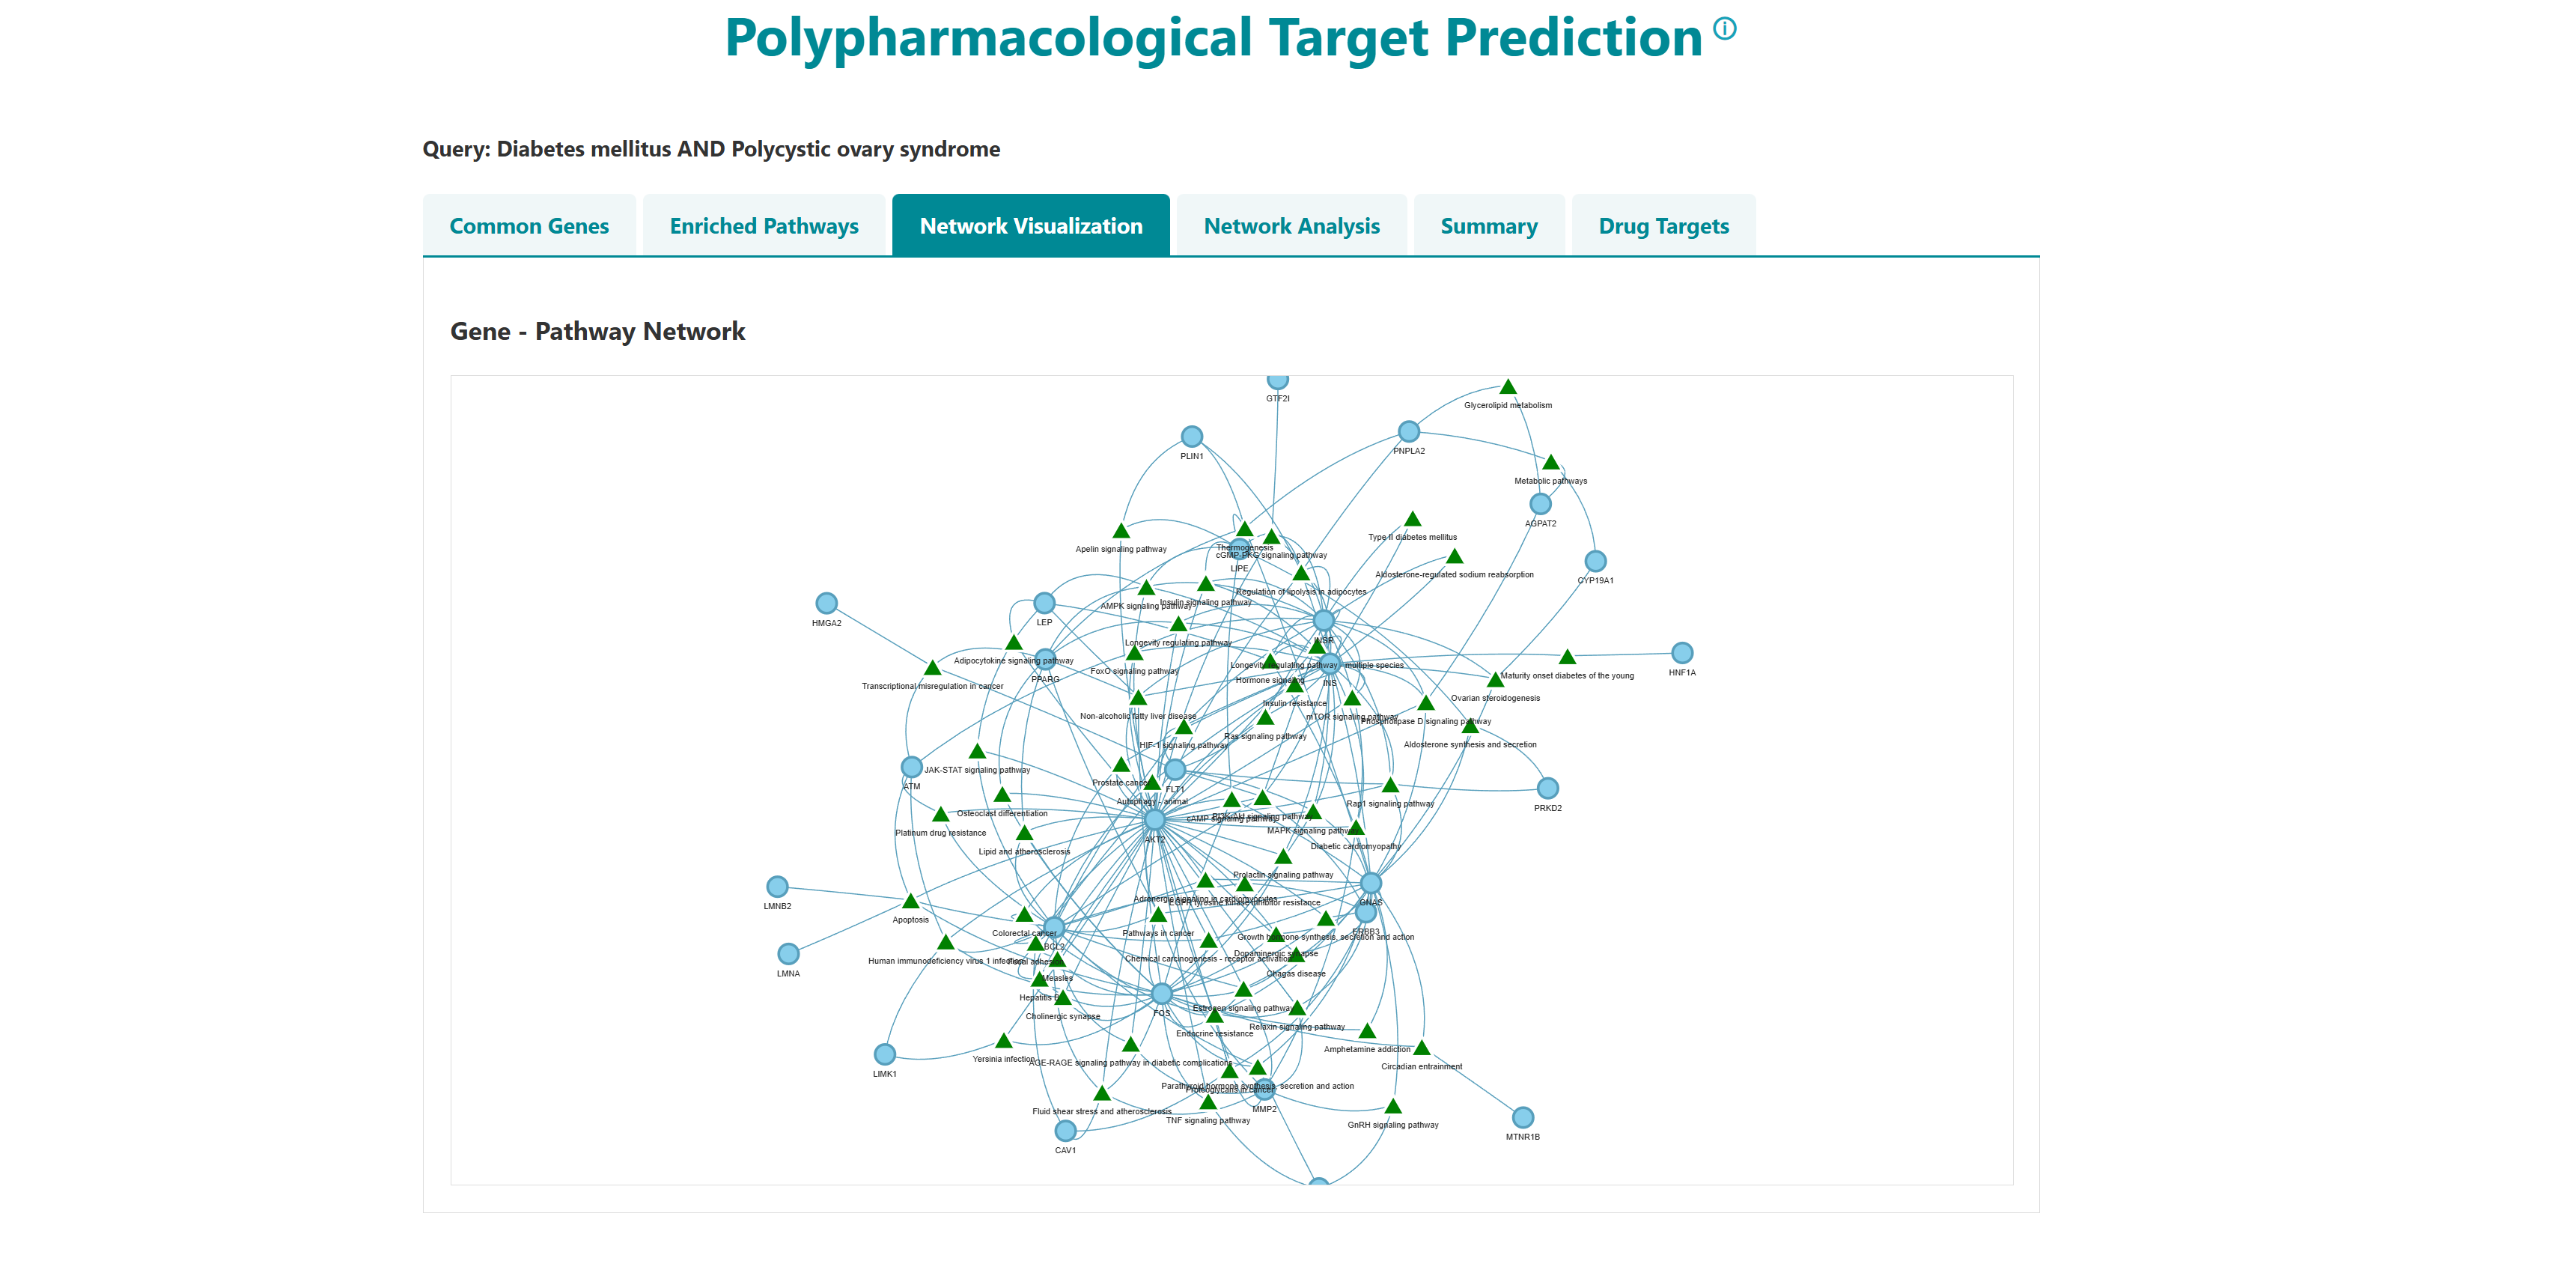
3.3 Polypharmacological target prediction
Using this tool, potential polypharmacological drug targets and their known drugs from DGIdb can be predicted. The homepage of the tool has a list of diseases. User can select any number of disease names using the search with autofill option and use -> symbol to move the name in "selected diseases" column. Multiple diseases can be selected using "ctrl" key of the keyboard. An option to deselect diseases by using <- symbol is also provided. Users can select from either of the two datasets, "Curated" and "Curated + Text mining". The submit button takes the user to the polypharmacological drug target prediction page.
3.4 Venn analysis
This tool can be used to illustrate the unique and/or common genes, pathways, ontologies, and Pfam domains for 2 or more (up to 6) diseases. A custom Venn for users to input their own data is also incorporated in the database.
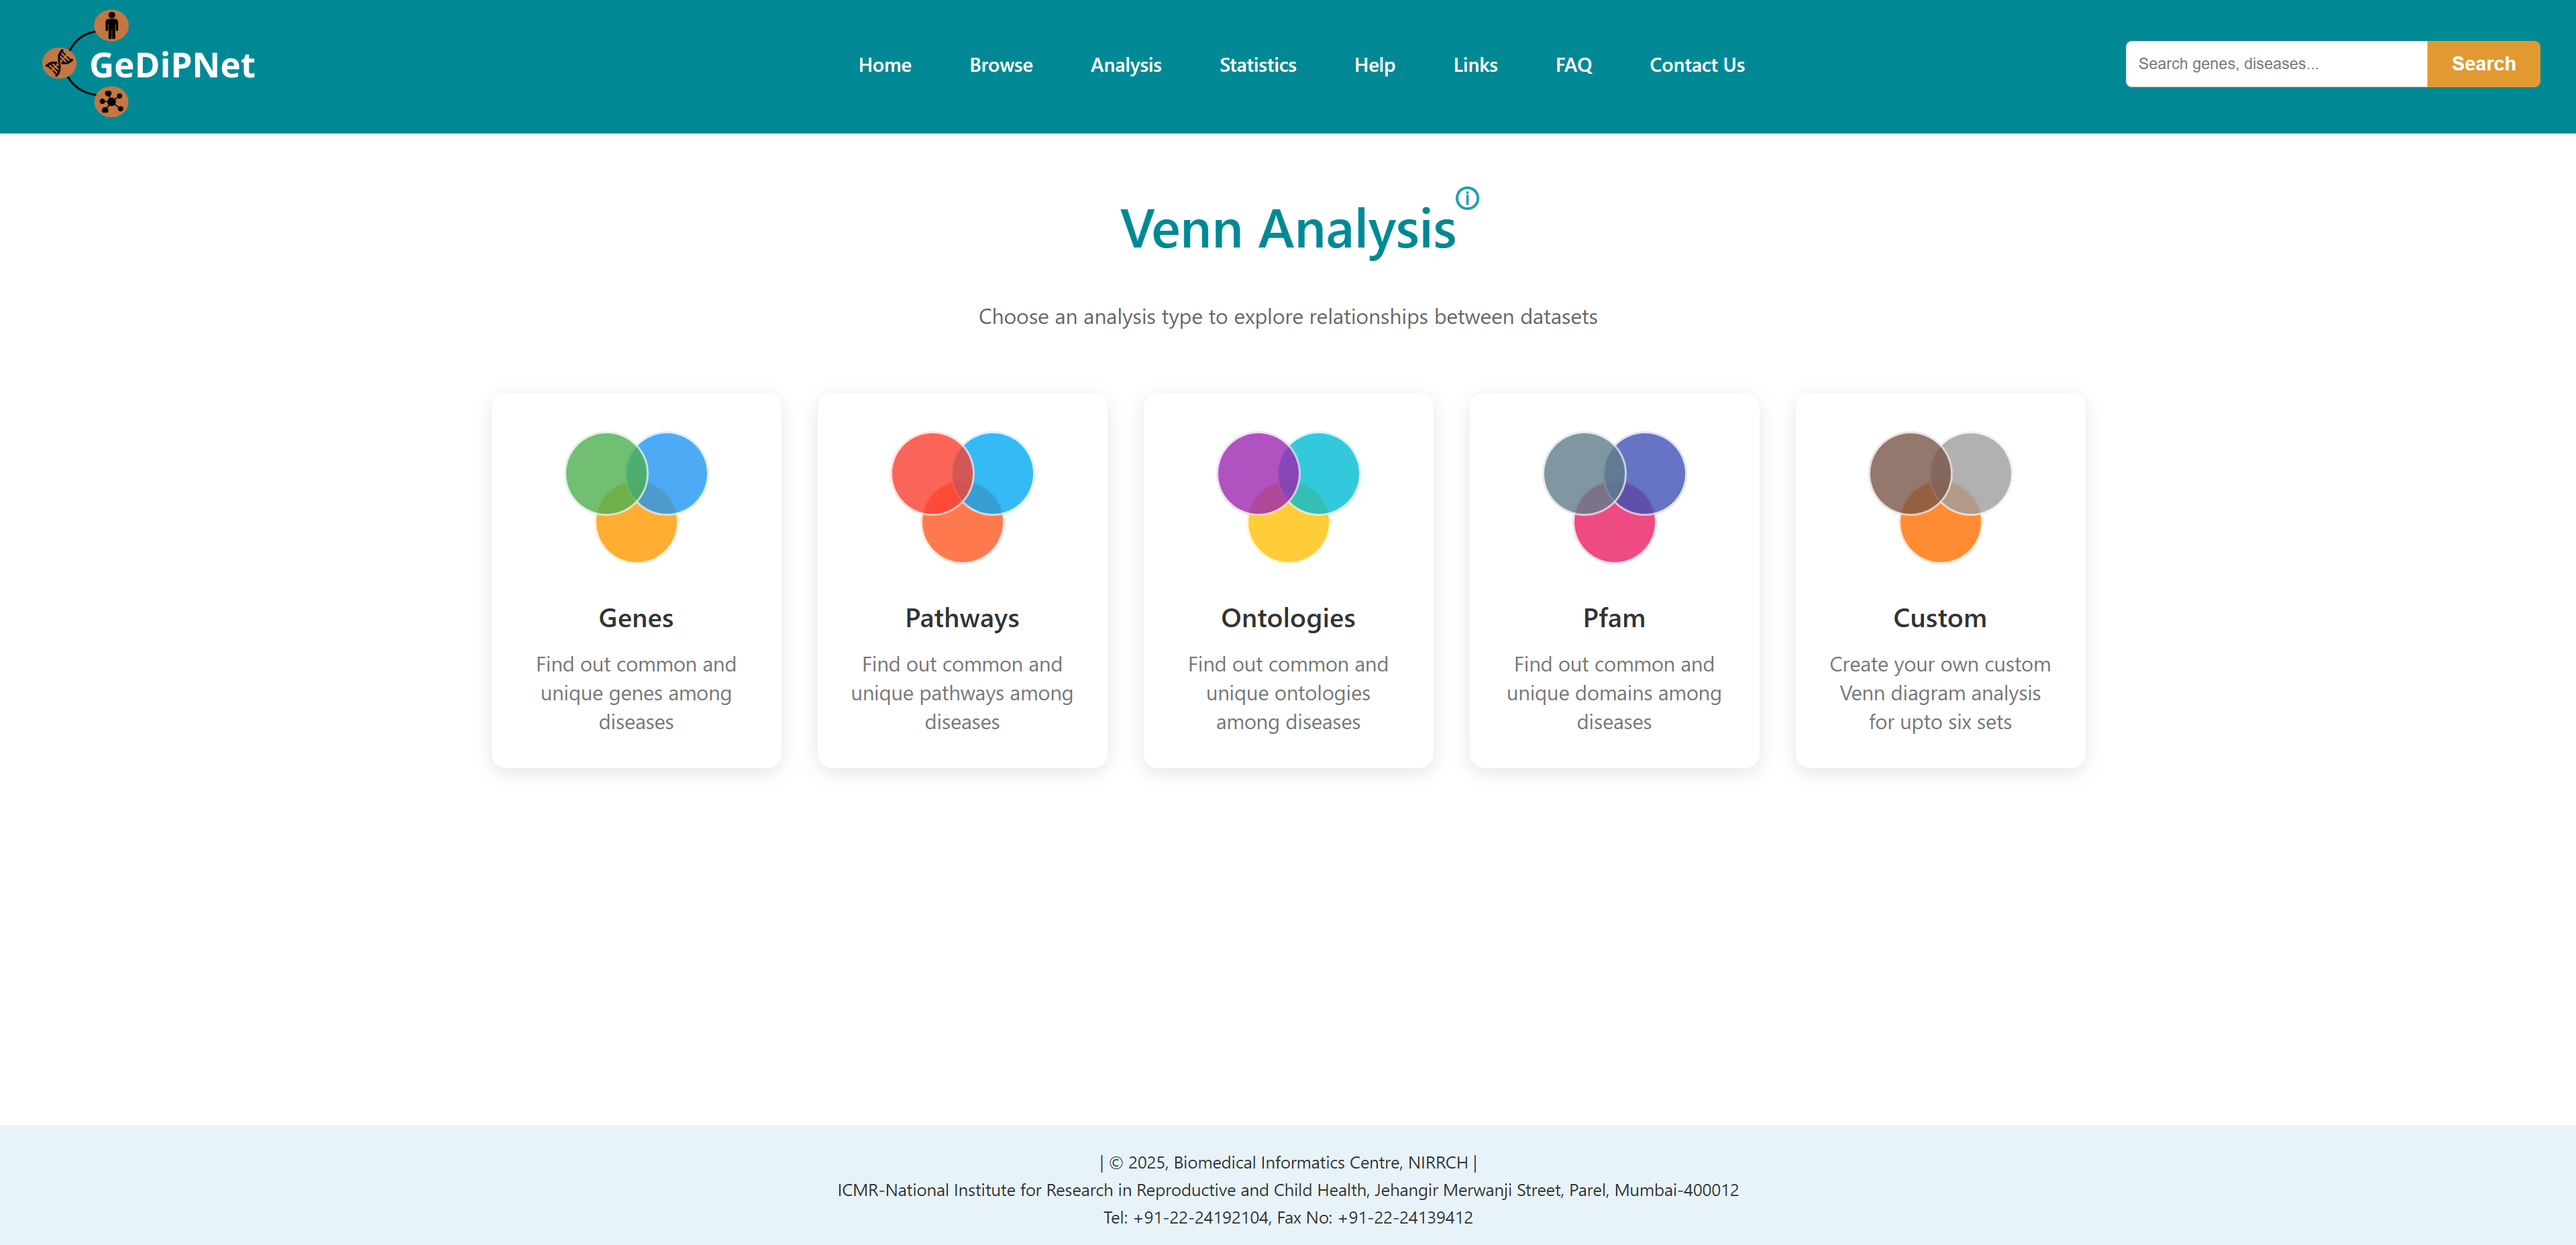
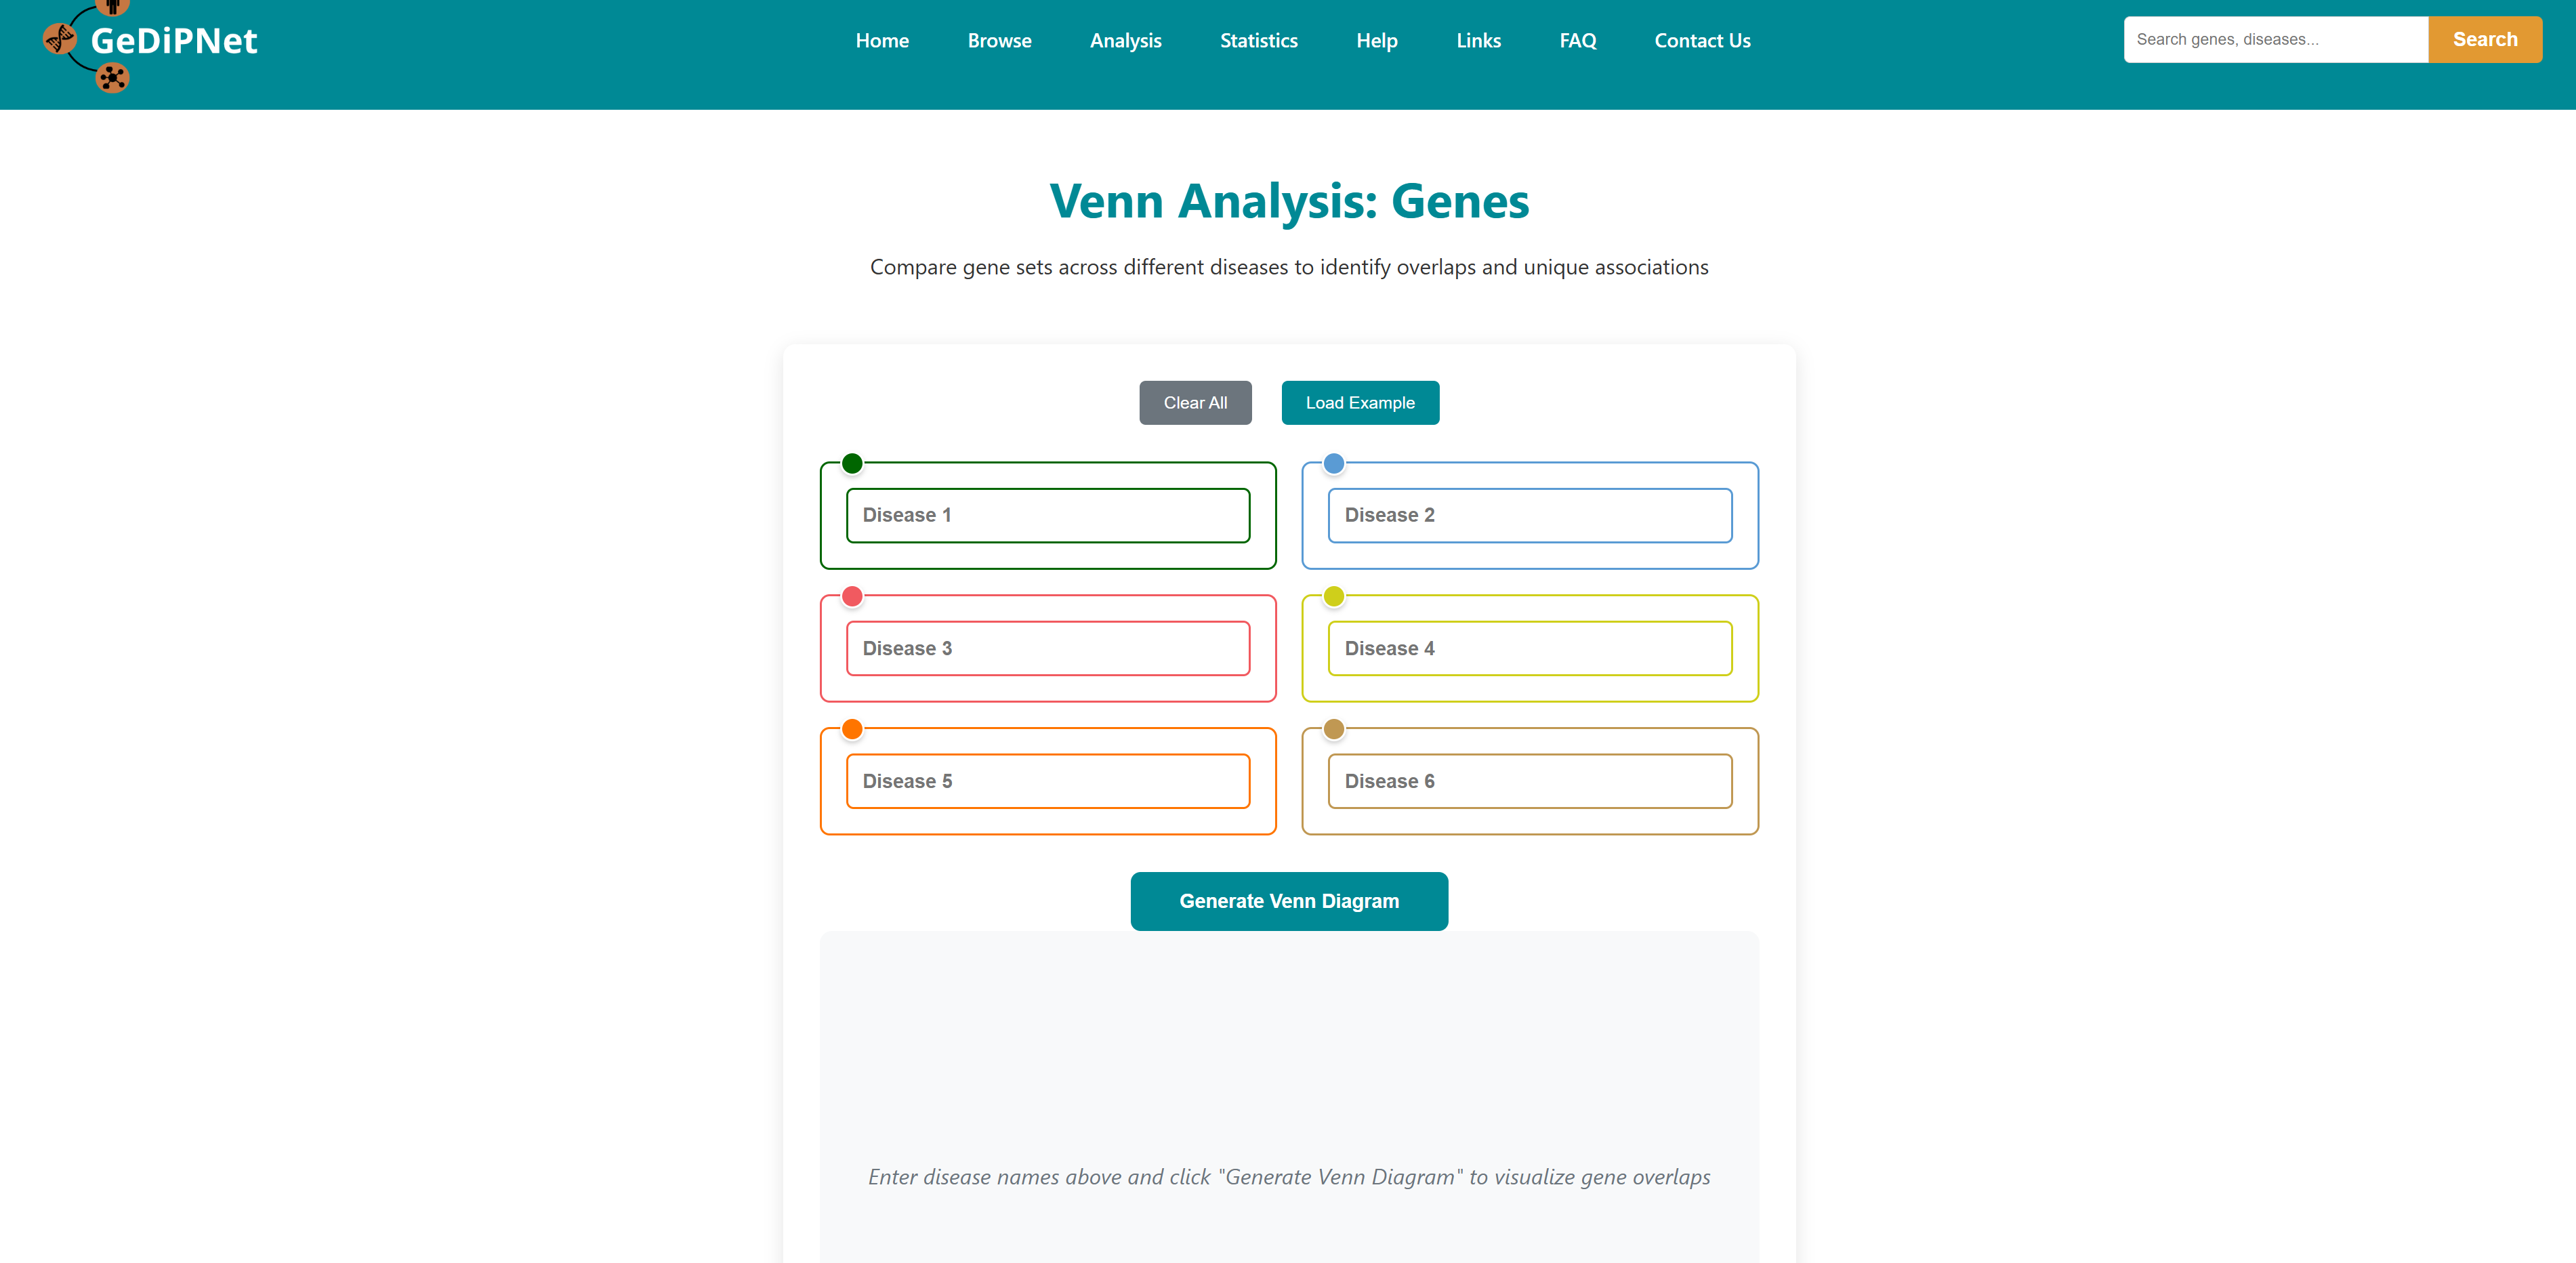
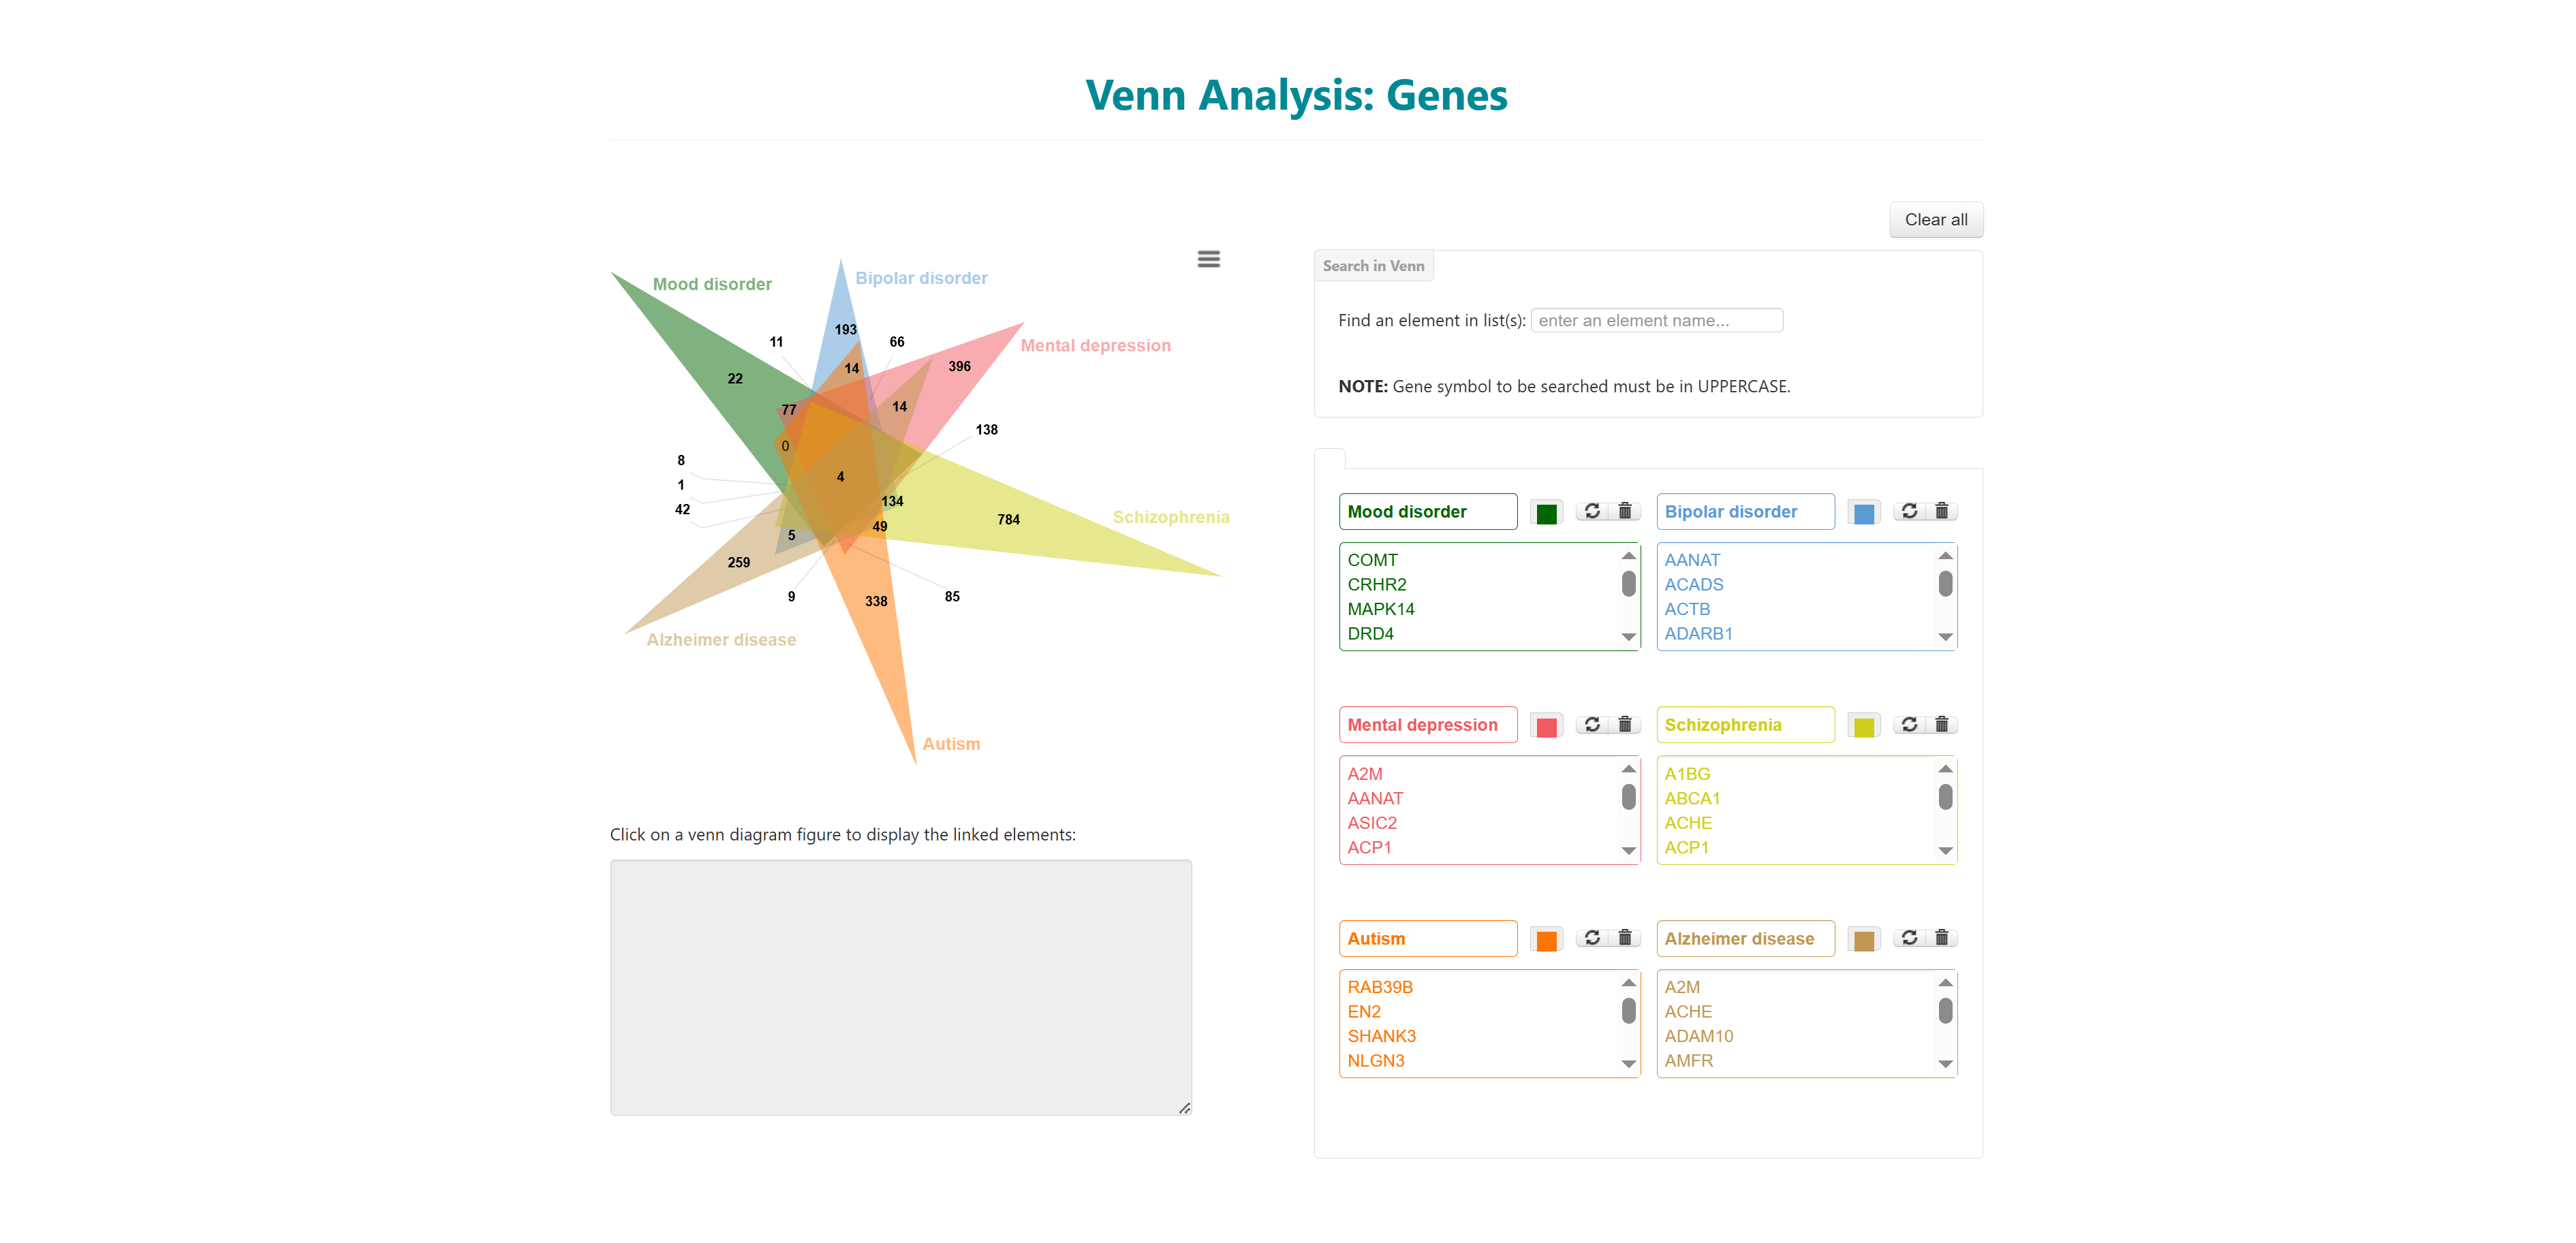
On selecting one type of Venn analysis, user will be redirected to the main page of that Venn. Disease name can be entered in each box or can be auto filled from the database. After selecting the names, click on Generate Venn Diagram. The user will be redirected to the output page. You can also load an example using the load example button on the top right to understand the output.
4. Cite us
If you use GeDiPNet in your research, please cite our work to help support the continued development and maintenance of this resource.
Citation:
Kundu I, Sharma M, Barai RS, Pokar K, Idicula-Thomas S. GeDiPNet: Online resource of curated gene-disease associations for polypharmacological targets discovery. Genes & Diseases, 2023. https://doi.org/10.1016/j.gendis.2022.05.034
For technical support, data queries, or collaboration opportunities, reach out to the Biomedical Informatics Centre at ICMR-NIRRCH, Mumbai, India.